OPEN-SOURCE SCRIPT
RSI Tree
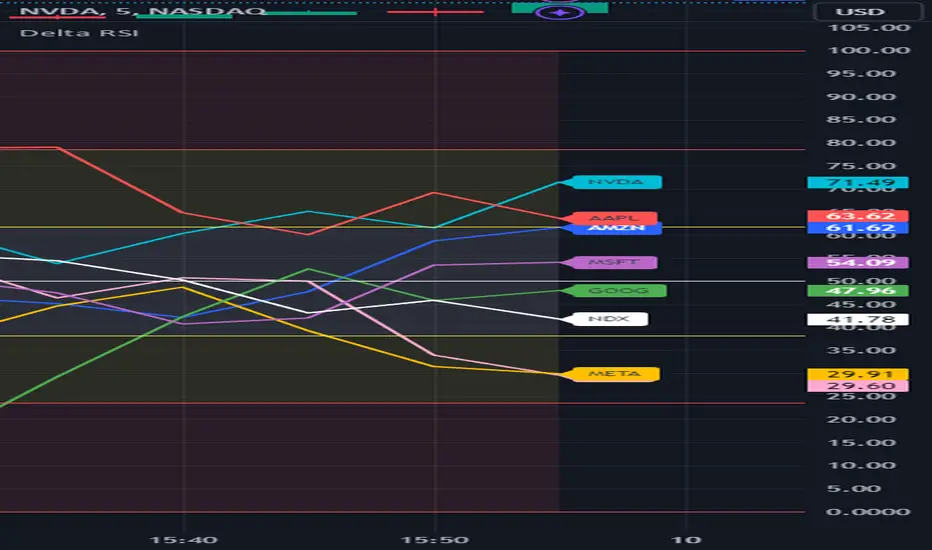
RSI Tree is a simple way to compare the strength of several different instruments against each other.

The default is to compare MSFT, NVDA, TSLA, GOOG, META, AMZN, AAPL and NASDAQ. You could do the same for currency pairs and any other instruments available in Trading View. However, it makes the most sense to compare seven instruments to an eighth underlying instrument. As you can see in the default values, we included the NASDAQ as the eighth instrument since the other seven are part of the NASDAQ composite index. If you were to trade major currency pairs, then your eighth instrument would most likely be the U.S. Dollar (DXY).
The chart setup is important as well. You need to split your chart horizontally into 4 plots. Each plot would be at a different timing interval. The example shows 4 hr, 1 hr, 15 min and 5 min (left to right) charts. Now not only can we compare the instruments against each other, but we can do it across time to get an idea of the motion of each instrument.
Note, the instrument used on the chart is somewhat important. If the chart is set to a currency pair, but you have the RSI Tree setup for equities (as in the default) then you will get some odd behavior due to the times when these are open. Equities are 0930 to 1600 EST, whereas something like a currency would be open 24 hours a day.
Layout for default settings: tradingview.com/chart/DqwSXvEH/
Bugs?
Kindly report any issues and I'll try to fix them promptly.
Thank you!
Open-source script
In true TradingView spirit, the creator of this script has made it open-source, so that traders can review and verify its functionality. Kudos to the author! While you can use it for free, remember that republishing the code is subject to our House Rules.
Disclaimer
The information and publications are not meant to be, and do not constitute, financial, investment, trading, or other types of advice or recommendations supplied or endorsed by TradingView. Read more in the Terms of Use.