OPEN-SOURCE SCRIPT
Updated Momentum RSI
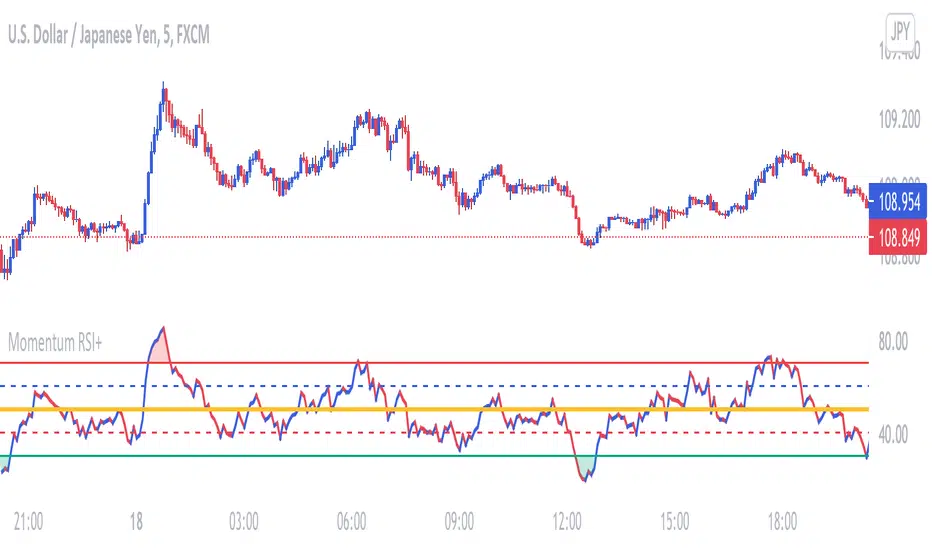
This RSI is used to determine price Momentum and Overbought or Oversold Market conditions. When the RSI is between 50% and 70% price is considered to have upward momentum. When The RSI is between 50% and 30% price is considered to have downward momentum. When the RSI is between 40% and 60% price is considered to have no directional momentum and is considered to be in consolidation. When the RSI is above 70% price is to be considered Overbought. When the RSI is bellow 30% price is to be considered Oversold
Release Notes
Renamed Hlines and changed standard colorRelease Notes
Style updateRelease Notes
RSI Line color update to show momentumAdded Green shade when RSI is Overbought and Red shade when RSI is Oversold
Open-source script
In true TradingView spirit, the creator of this script has made it open-source, so that traders can review and verify its functionality. Kudos to the author! While you can use it for free, remember that republishing the code is subject to our House Rules.
Disclaimer
The information and publications are not meant to be, and do not constitute, financial, investment, trading, or other types of advice or recommendations supplied or endorsed by TradingView. Read more in the Terms of Use.