OPEN-SOURCE SCRIPT
Difference of Exponentially Weighted Averages
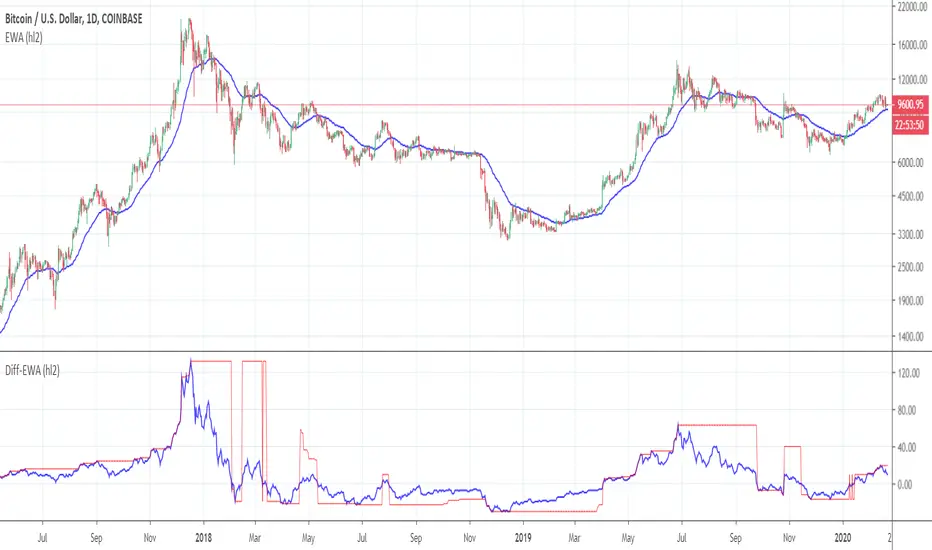
Implementation of Difference of Exponentially Weighted Averages in Pine Script. It can generate a line that adjust to the overall trend of a graphic. The lines that are generated in a new plot are the the Difference of Exponentially Weighted Averages (blue) and it binarization over the previous values.
Exponentially Weighted Averages
This technique is used for generating smoother lines that adjust to a graphic. In finances, it is used to predict the overall trend of a graphic. The function that defines the EWA is the one bellow:
Where:
The calculus of differences consist in subtract to each value the previous values.
Exponentially Weighted Averages
This technique is used for generating smoother lines that adjust to a graphic. In finances, it is used to predict the overall trend of a graphic. The function that defines the EWA is the one bellow:
- Vt = β V(t-1) + (1 - β) θt
Where:
- β: Hyper-parameter that we have to adjust.
- V(t-1): Value calculated for the previous element of the graphic.
- θt: Current element of the graphic.
The calculus of differences consist in subtract to each value the previous values.
Open-source script
In true TradingView spirit, the creator of this script has made it open-source, so that traders can review and verify its functionality. Kudos to the author! While you can use it for free, remember that republishing the code is subject to our House Rules.
Disclaimer
The information and publications are not meant to be, and do not constitute, financial, investment, trading, or other types of advice or recommendations supplied or endorsed by TradingView. Read more in the Terms of Use.