OPEN-SOURCE SCRIPT
Buffett Indicator (Wilshire 5000 / GDP)
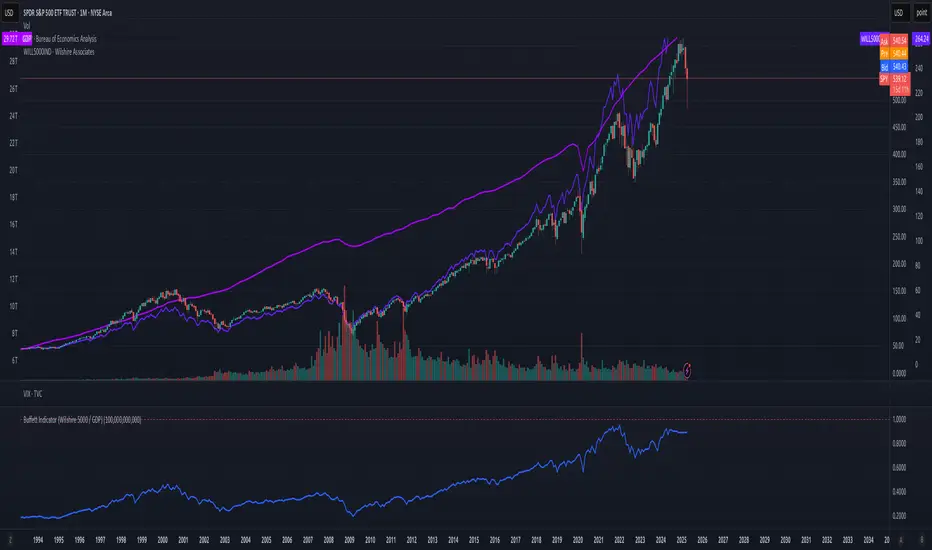
The Buffett Indicator (Wilshire 5000 / GDP) is a macroeconomic metric used to assess whether the U.S. stock market is overvalued or undervalued. It is calculated by dividing the total market capitalization (represented by the Wilshire 5000 Index) by the U.S. Gross Domestic Product (GDP). A value above 1 (or 100%) may indicate an overvalued market, while a value below 1 suggests potential undervaluation. This indicator is best suited for long-term investment analysis.
Open-source script
In true TradingView spirit, the creator of this script has made it open-source, so that traders can review and verify its functionality. Kudos to the author! While you can use it for free, remember that republishing the code is subject to our House Rules.
Disclaimer
The information and publications are not meant to be, and do not constitute, financial, investment, trading, or other types of advice or recommendations supplied or endorsed by TradingView. Read more in the Terms of Use.