OPEN-SOURCE SCRIPT
Updated [blackcat] L2 Super Oscillator
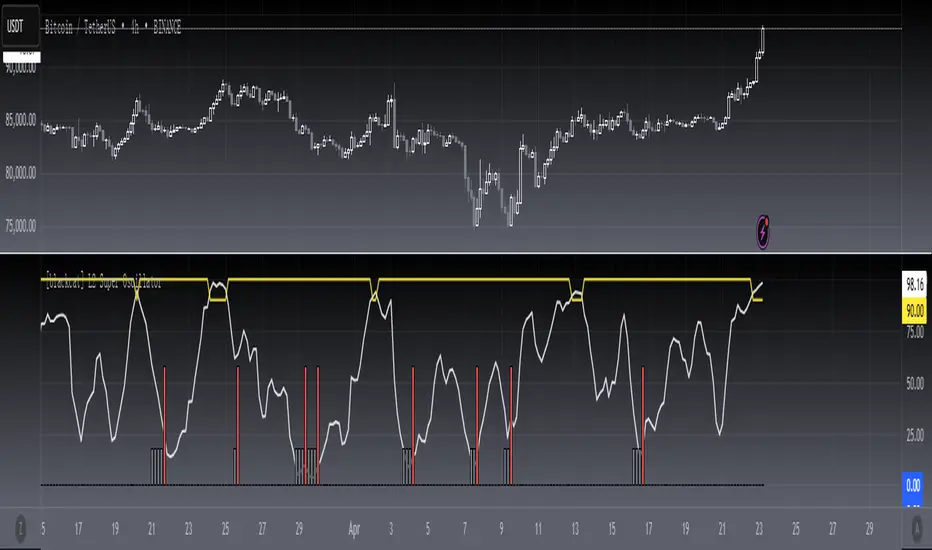
Level2
Background
A super oscillator with overbought and oversold detections.
Function
Represented by a white line, this Super Oscillator indicator identifies instruments that are overbought or oversold, which can be an important part of determining buy and sell points. An oversold market is a market that has fallen sharply and is expected to recover. In this indicator, gray candlesticks are used at the bottom to show that an oversold zone is near and a red candlestick shows that the overbought zone is ending. On the other hand, an overbought market has risen sharply and could be ripe for a decline. Yellow line dips are used to indicate overbought zones.
Remarks
Feedbacks are appreciated.
Release Notes
OVERVIEWThe [blackcat] L2 Super Oscillator is an advanced technical indicator designed to help traders identify potential buy and sell opportunities by analyzing price momentum and volatility. This script combines multiple oscillators and custom algorithms to provide a comprehensive view of market conditions. It plots various signals on the chart, making it easier for traders to make informed decisions 📈💹.
FEATURES
Calculates and plots the Super Oscillator:
Combines weighted sum averages and relative strength values.
Provides insights into market momentum and volatility.
Includes additional oscillators:
Relative Strength Value: Measures price strength over a specified period.
Adjusted EMA: Adjusts Exponential Moving Average based on price action.
Fast Line, Slow Line, and Void Value: Additional indicators for trend identification.
Plots visual signals on the chart:
Gray bars indicate oscillator zones.
Red bars signal potential long conditions.
Generates alerts based on specific crossover events and conditions 🔔
HOW TO USE
Add the indicator to your TradingView chart by selecting it from the indicators list.
Monitor the plotted signals on the chart:
Gray bars represent oscillator zones indicating potential market movements.
Red bars signify potential long conditions.
Set up alerts based on the generated signals to receive notifications when conditions are met 📲.
Combine this indicator with other forms of analysis for more reliable trading decisions.
LIMITATIONS
The indicator may generate false signals in highly volatile or ranging markets 🌪️.
Users should always confirm signals with other tools before making trading decisions.
The effectiveness of the indicator may vary depending on the asset and timeframe being analyzed.
NOTES
Ensure that you have sufficient historical data available for accurate calculations.
Test the indicator thoroughly on demo accounts before applying it to live trading 🔍.
Customize the parameters as needed to fit your trading strategy.
Open-source script
In true TradingView spirit, the creator of this script has made it open-source, so that traders can review and verify its functionality. Kudos to the author! While you can use it for free, remember that republishing the code is subject to our House Rules.
Avoid losing contact!Don't miss out! The first and most important thing to do is to join my Discord chat now! Click here to start your adventure: discord.com/invite/ZTGpQJq 防止失联,请立即行动,加入本猫聊天群: discord.com/invite/ZTGpQJq
Disclaimer
The information and publications are not meant to be, and do not constitute, financial, investment, trading, or other types of advice or recommendations supplied or endorsed by TradingView. Read more in the Terms of Use.