OPEN-SOURCE SCRIPT
Updated Recent High/Low Dots by Alejandro P
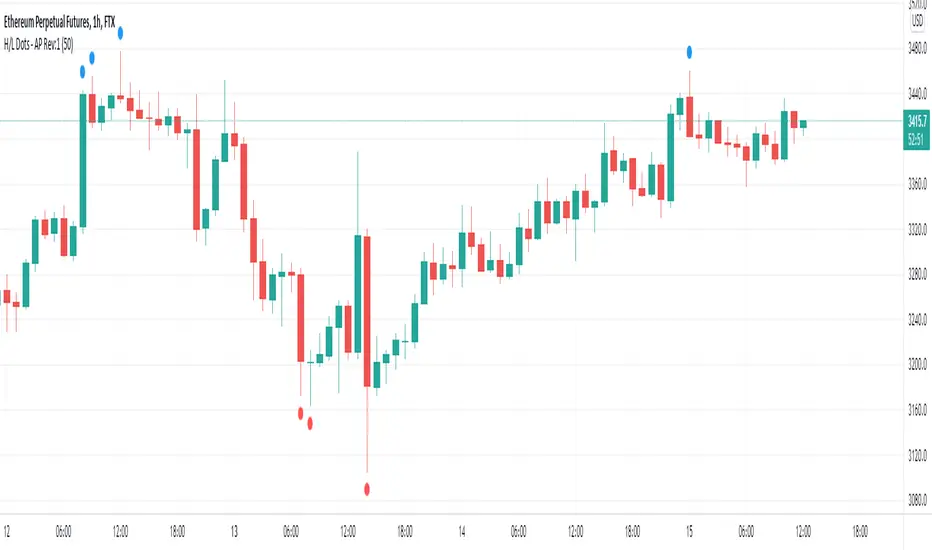
Simple indicator that plots a dot in the chart when a candle breaks the high of the past X candles.
This is useful to easily visualize when the market is coming out of a range and making fresh highs or lows relative to the past X candles.
It can be used in trend following systems as an additional filter for validation.
This is useful to easily visualize when the market is coming out of a range and making fresh highs or lows relative to the past X candles.
It can be used in trend following systems as an additional filter for validation.
Release Notes
Updated to pinescript 5 and added alert conditions for easy alert creationRelease Notes
Corrected allertcondition so it now actually triggers.Open-source script
In true TradingView spirit, the creator of this script has made it open-source, so that traders can review and verify its functionality. Kudos to the author! While you can use it for free, remember that republishing the code is subject to our House Rules.
Disclaimer
The information and publications are not meant to be, and do not constitute, financial, investment, trading, or other types of advice or recommendations supplied or endorsed by TradingView. Read more in the Terms of Use.
Open-source script
In true TradingView spirit, the creator of this script has made it open-source, so that traders can review and verify its functionality. Kudos to the author! While you can use it for free, remember that republishing the code is subject to our House Rules.
Disclaimer
The information and publications are not meant to be, and do not constitute, financial, investment, trading, or other types of advice or recommendations supplied or endorsed by TradingView. Read more in the Terms of Use.