OPEN-SOURCE SCRIPT
Trend Table ZeeZeeMon
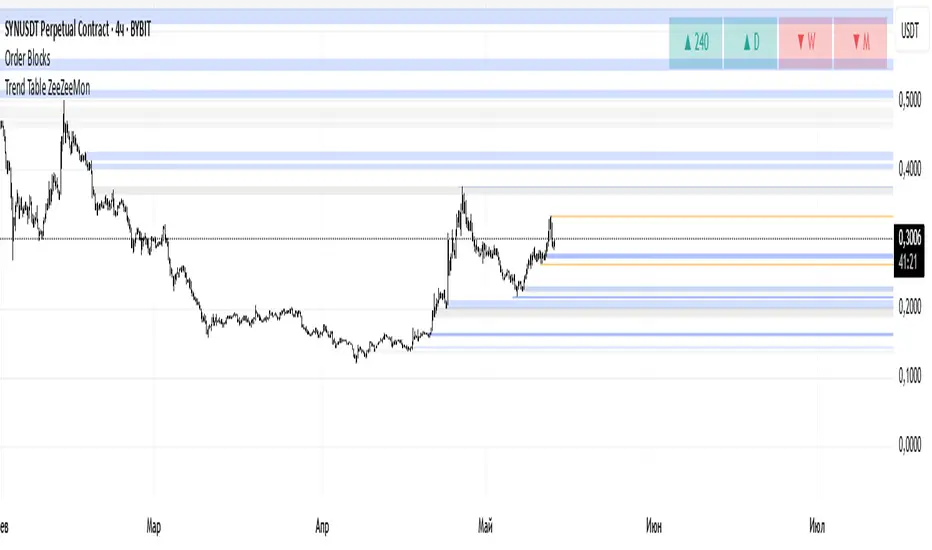
Multi-Timeframe Trend Indicator
Overview
This indicator identifies trends across multiple higher timeframes and displays them in a widget on the right side of the chart. It serves as an alternative trend-filtering tool, helping traders align with the dominant market direction. Unlike traditional moving average-based trend detection (e.g., price above/below a 200 MA), this indicator assesses whether higher timeframes are genuinely trending by analyzing swing highs and lows.
Trend Definition
Uptrend: Higher highs and higher lows.
Downtrend: Lower highs and lower lows.
A trend reversal occurs when a prior high/low is breached (e.g., in a downtrend, breaking the last high signals an uptrend).
Customization Options
Lookback Period: Adjusts the sensitivity for identifying swing highs/lows (pivot points). A shorter lookback detects more frequent pivots.
Historical Pivot Visibility: Toggle to display past swing highs/lows for verification.
Support/Resistance Lines: Show dynamic levels from recent pivots on higher timeframes. Breaching these lines indicates potential trend changes.
Purpose
Helps traders:
Confirm higher timeframe trends before entering trades.
Monitor proximity to trend reversals.
Fine-tune pivot sensitivity for optimal trend detection.
Note: Works best as a supplementary trend filter alongside other trading strategies.
Open-source script
In true TradingView spirit, the creator of this script has made it open-source, so that traders can review and verify its functionality. Kudos to the author! While you can use it for free, remember that republishing the code is subject to our House Rules.
Disclaimer
The information and publications are not meant to be, and do not constitute, financial, investment, trading, or other types of advice or recommendations supplied or endorsed by TradingView. Read more in the Terms of Use.