OPEN-SOURCE SCRIPT
Updated Qu_Trend+
composition
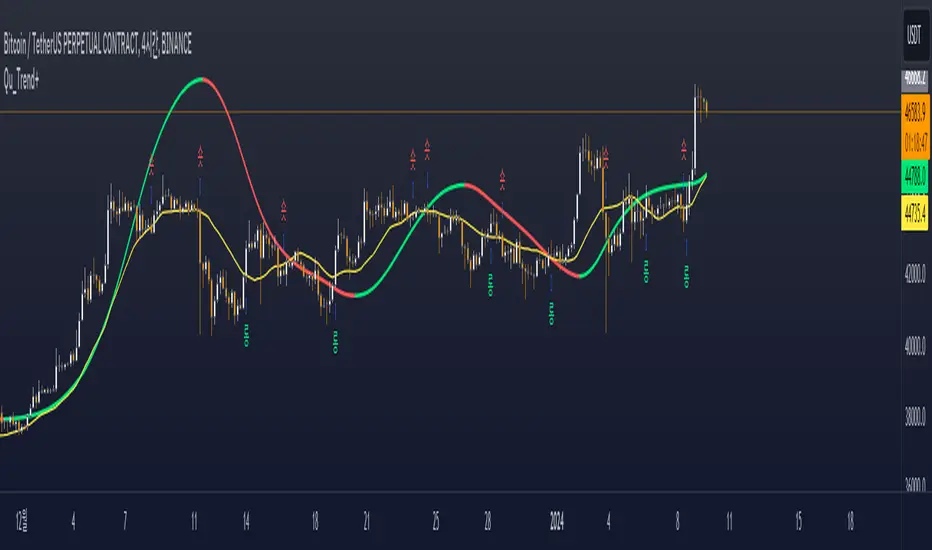
- Consists of a thick trend line and a thin yellow line.
- The largest (green/red) lines indicate rising and falling markets.
- This line represents the 13-candle moving average of Tilson T3.
- The reason for 13 candles is because it best matches the recent market price based on Bitcoin.
- This value cannot be changed, so if you need it, please modify the public code and use it.
- The yellow line is the MA20 line, the ‘Bollinger Band center line’
(UI will show whether this line has been breakout)
- The same algorithm as 20 of the basic moving average (close standard) is applied.
- The algorithm for breakthrough is calculated based on real-time prices, not based on closing prices.
An additional short-term SMA is created, and whether it crosses the SMA is classified as a breakout/resistance.
How to use it
- If the trend line becomes gentle, it may indicate a change in trend when + MA20 is broken.
- While the slope of the trend line is steep, it indicates that the trend is difficult to change.
(If the trend changes at this time, it is likely to move sideways)
- If the trend changes continuously, it is a sideways market.
At this time, watch out for the movement of the end point where the sideways trend ends.
Release Notes
Rev. 1.01Open-source script
In true TradingView spirit, the creator of this script has made it open-source, so that traders can review and verify its functionality. Kudos to the author! While you can use it for free, remember that republishing the code is subject to our House Rules.
📌차트스쿨 소통방 : open.kakao.com/o/gy2lUtyf
📌차트스쿨 유튜브 : youtube.com/@_chartschool
📌실시간 관점 알리미 봇 : t.me/+n100qkRnxns0OGJl
📌차트스쿨 유튜브 : youtube.com/@_chartschool
📌실시간 관점 알리미 봇 : t.me/+n100qkRnxns0OGJl
Disclaimer
The information and publications are not meant to be, and do not constitute, financial, investment, trading, or other types of advice or recommendations supplied or endorsed by TradingView. Read more in the Terms of Use.
Open-source script
In true TradingView spirit, the creator of this script has made it open-source, so that traders can review and verify its functionality. Kudos to the author! While you can use it for free, remember that republishing the code is subject to our House Rules.
📌차트스쿨 소통방 : open.kakao.com/o/gy2lUtyf
📌차트스쿨 유튜브 : youtube.com/@_chartschool
📌실시간 관점 알리미 봇 : t.me/+n100qkRnxns0OGJl
📌차트스쿨 유튜브 : youtube.com/@_chartschool
📌실시간 관점 알리미 봇 : t.me/+n100qkRnxns0OGJl
Disclaimer
The information and publications are not meant to be, and do not constitute, financial, investment, trading, or other types of advice or recommendations supplied or endorsed by TradingView. Read more in the Terms of Use.