OPEN-SOURCE SCRIPT
TS Multi-Indicator Trend Detector
Developed by KP
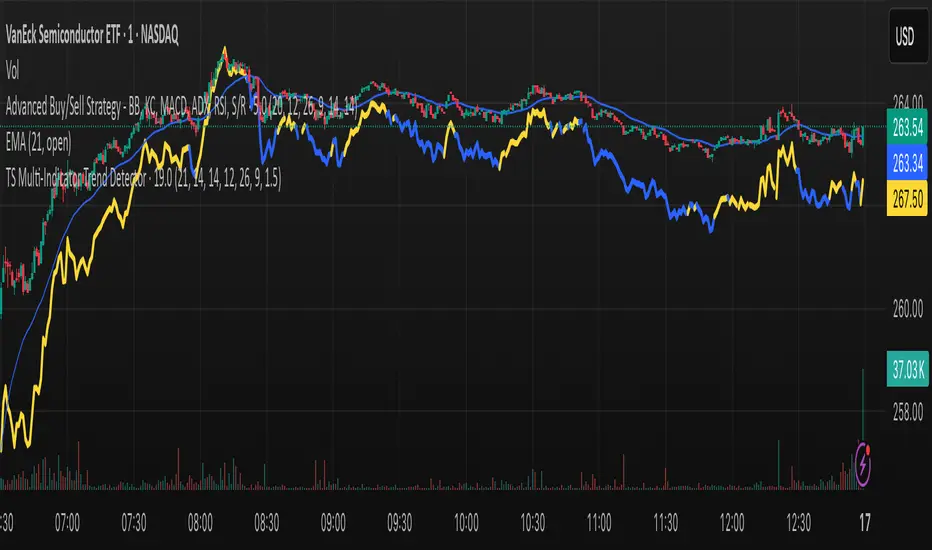
This indicator provides a visually clean and reliable trend overlay by combining multiple high-confidence technical indicators into a single floating line above price action. It’s designed for traders who want trend clarity without chart clutter.
⸻
🔍 What It Does:
• Uses EMA (21), RSI, MACD, ADX, and Directional Movement (DI) indicators to evaluate the market trend
• Assigns a “Bullish” or “Bearish” score based on how many indicators confirm the trend
• Plots a floating colored trend line above the price candles to avoid visual interference
• 🟡 Yellow Line = Bullish Trend
• 🔵 Blue Line = Bearish Trend
• Built with multi-timeframe compatibility (works on 5m to weekly charts)
• Minimalist, no noise — no arrows, no labels, just clarity
⸻
⚙️ How It Works:
• Trend shifts when 3 or more out of 5 conditions are met:
• Price above/below 21 EMA
• RSI > 50 or < 50
• MACD crossover
• ADX strength confirmation
• Directional movement dominance (+DI vs -DI)
⸻
🧠 Why Use This?
Unlike traditional moving averages or lagging signals, this tool filters market noise using a multi-indicator consensus approach, then visualizes it as a non-intrusive floating trend line — helping you focus only on meaningful price action.
⸻
✅ Best For:
• Swing traders, intraday trend followers, and algo developers
• Clean-chart enthusiasts who value signal quality over quantity
⸻
Open-source script
In true TradingView spirit, the creator of this script has made it open-source, so that traders can review and verify its functionality. Kudos to the author! While you can use it for free, remember that republishing the code is subject to our House Rules.
Disclaimer
The information and publications are not meant to be, and do not constitute, financial, investment, trading, or other types of advice or recommendations supplied or endorsed by TradingView. Read more in the Terms of Use.