OPEN-SOURCE SCRIPT
Smart % Levels
📈 Smart % Levels – Visualize Significant Percentage Moves
What it does:
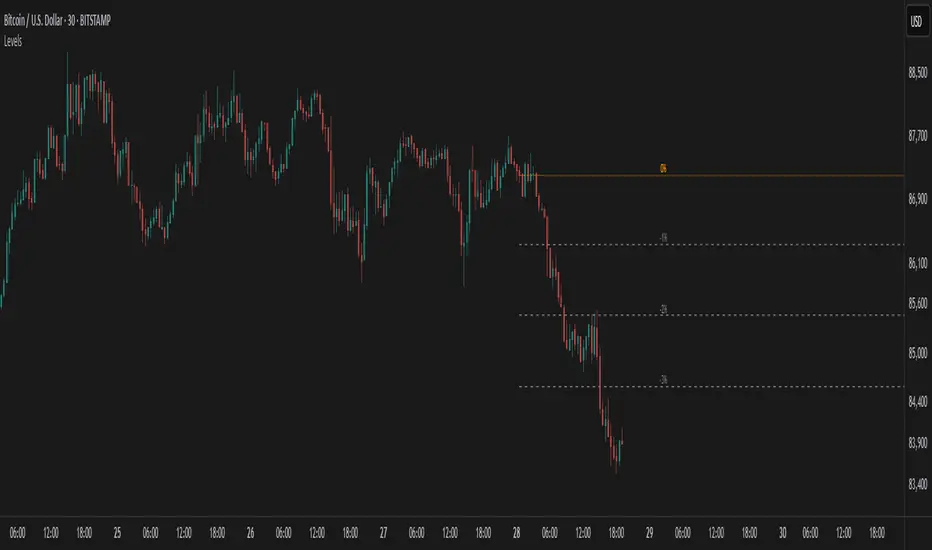
This indicator plots horizontal levels based on a percentage change from the previous day's close (or open, if selected). It allows traders to visualize price movements relative to meaningful thresholds like ±1%, ±2%, etc.
What makes it different:
Unlike other level indicators, Smart % Levels only displays the relevant levels based on current price action. This avoids clutter by showing only the levels that are being approached or crossed by the current price. It's a clean and dynamic way to visualize key price zones for intraday analysis.
How it works:
- Select between using the previous day's Close or Open as the reference
- Choose the percentage spacing between levels (e.g., 1%, 0.5%, etc.)
- Enable optional labels to see the exact percentage of each level
- Automatically filters levels to only show those between yesterday's price and today's current price
- Includes customization for colors, line styles, widths, and opacity
Best for:
Day traders and scalpers who want a quick, clean view of how far the current price has moved from yesterday’s reference, without being overwhelmed by unnecessary lines.
Extra notes:
- The levels are recalculated each day at the market open
- All graphics reset at the start of each session to maintain clarity
- This script avoids repainting by only plotting levels relative to available historical data (no lookahead)
This tool is for informational purposes only and should not be considered as financial advice. Always do your own research before making trading decisions.
What it does:
This indicator plots horizontal levels based on a percentage change from the previous day's close (or open, if selected). It allows traders to visualize price movements relative to meaningful thresholds like ±1%, ±2%, etc.
What makes it different:
Unlike other level indicators, Smart % Levels only displays the relevant levels based on current price action. This avoids clutter by showing only the levels that are being approached or crossed by the current price. It's a clean and dynamic way to visualize key price zones for intraday analysis.
How it works:
- Select between using the previous day's Close or Open as the reference
- Choose the percentage spacing between levels (e.g., 1%, 0.5%, etc.)
- Enable optional labels to see the exact percentage of each level
- Automatically filters levels to only show those between yesterday's price and today's current price
- Includes customization for colors, line styles, widths, and opacity
Best for:
Day traders and scalpers who want a quick, clean view of how far the current price has moved from yesterday’s reference, without being overwhelmed by unnecessary lines.
Extra notes:
- The levels are recalculated each day at the market open
- All graphics reset at the start of each session to maintain clarity
- This script avoids repainting by only plotting levels relative to available historical data (no lookahead)
This tool is for informational purposes only and should not be considered as financial advice. Always do your own research before making trading decisions.
Open-source script
In true TradingView spirit, the creator of this script has made it open-source, so that traders can review and verify its functionality. Kudos to the author! While you can use it for free, remember that republishing the code is subject to our House Rules.
The trend is your friend, until it's not...
Disclaimer
The information and publications are not meant to be, and do not constitute, financial, investment, trading, or other types of advice or recommendations supplied or endorsed by TradingView. Read more in the Terms of Use.