OPEN-SOURCE SCRIPT
Market Condition Detector By BCB Elevate
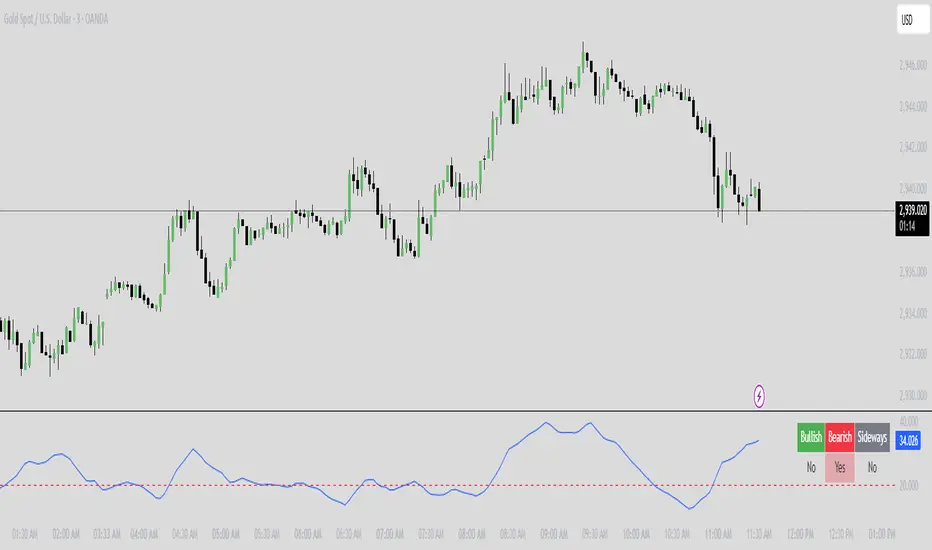
Market Condition Detector - Bullish, Bearish & Sideways Market Indicator
This indicator helps traders identify bullish, bearish, and sideways market conditions using the Average Directional Index (ADX). It calculates trend strength and direction to categorize the market into three phases:
✅ Bullish Market: ADX is above the threshold, and the positive directional index (+DI) is greater than the negative directional index (-DI).
❌ Bearish Market: ADX is above the threshold, and +DI is lower than -DI.
🔄 Sideways Market: ADX is below the threshold, indicating weak trend strength and potential consolidation.
Features:
🔹 Dynamic Market Classification - Automatically detects and updates market conditions.
🔹 Table Display - Clearly shows whether the market is bullish, bearish, or sideways in a user-friendly format.
🔹 Customizable Settings - Adjust ADX period and threshold to suit different trading strategies.
🔹 Works on All Markets - Use for Crypto, Forex, Stocks, Commodities, and Indices.
This tool is ideal for trend traders, swing traders, and breakout traders looking to optimize entries and exits.
📌 How to Use:
1️⃣ Apply it to any chart and timeframe.
2️⃣ Use the table to confirm market conditions before taking trades.
3️⃣ Combine with other indicators like moving averages, RSI, or volume analysis for better trade decisions.
Open-source script
In true TradingView spirit, the creator of this script has made it open-source, so that traders can review and verify its functionality. Kudos to the author! While you can use it for free, remember that republishing the code is subject to our House Rules.
Disclaimer
The information and publications are not meant to be, and do not constitute, financial, investment, trading, or other types of advice or recommendations supplied or endorsed by TradingView. Read more in the Terms of Use.