OPEN-SOURCE SCRIPT
Open Interest Screener (Fixed Zones)
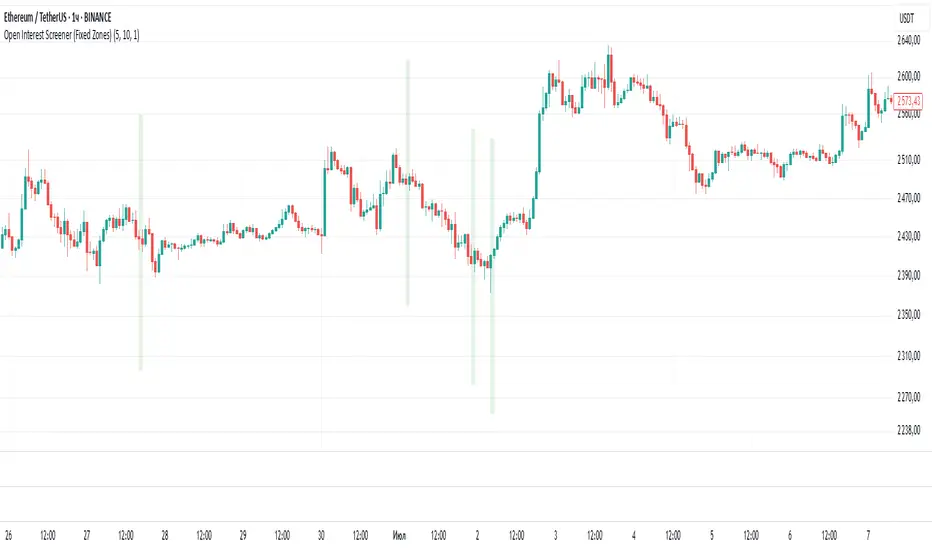
📌 Purpose
This indicator scans Open Interest (OI) changes across selected exchanges and highlights significant spikes or drops directly on the chart using dynamic shaded zones.
It is designed to help traders detect unusual market positioning changes that may precede volatility events.
🧠 How It Works
1. Data Sources
Supports multiple exchanges: BitMEX USD, BitMEX USDT, Kraken USD (toggle on/off in settings).
Automatically adapts symbol prefix based on the chart’s base asset.
2. Spike / Drop Detection
OI % Change is calculated over a configurable lookback (Bars to look back).
Spike Up: OI increases by more than Threshold %.
Spike Down: OI decreases by more than Threshold %.
3. Dynamic Zones
When a spike occurs, a green zone (increase) or red zone (decrease) is drawn on the chart.
Zone height is dynamic, based on price high/low ± 5%, preventing chart distortion.
Minimum spacing (Zone Spacing) prevents clustering.
📈 How to Use
Green Zones: Large OI increase can signal fresh positioning (possible breakout setups).
Red Zones: Large OI decrease can signal liquidation events or position unwinds.
Combine with price action, funding rates, or volatility measures for higher confidence.
Recommended Timeframes: Works best on 15m, 1h, 4h.
Markets: Crypto derivatives (OI data available).
⚙️ Inputs
Bars to Look Back
OI % Change Threshold
Zone Width
Exchange toggles (BitMEX USD/USDT, Kraken USD)
⚠️ Disclaimer
This script is for educational purposes only and does not constitute financial advice.
Always test thoroughly before live trading.
Open-source script
In true TradingView spirit, the creator of this script has made it open-source, so that traders can review and verify its functionality. Kudos to the author! While you can use it for free, remember that republishing the code is subject to our House Rules.
Disclaimer
The information and publications are not meant to be, and do not constitute, financial, investment, trading, or other types of advice or recommendations supplied or endorsed by TradingView. Read more in the Terms of Use.