OPEN-SOURCE SCRIPT
Multi-Timeframe Opening Dots with Plotchar
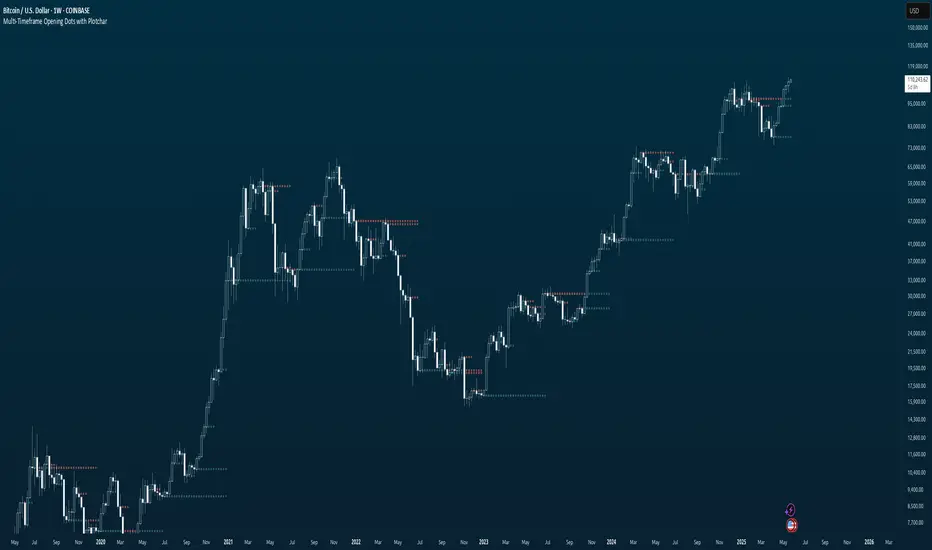
Plot clean, smart dots that mark where the real action starts — the opening levels of the three higher timeframes above your current chart.
How it works:
Automatically grabs the next 3 higher timeframes.
Drops a slick dot right at each opening price — but only while that bar is still active.
Color-coded at a glance: Price above open? → green dot. Price below open? → red dot.
Why it’s useful: Get instant visual cues on higher timeframe opens — powerful markers for support, resistance, and directional bias.
Perfect for intraday traders and swing strategists who want to stay synced with the big picture.
Open-source script
In true TradingView spirit, the creator of this script has made it open-source, so that traders can review and verify its functionality. Kudos to the author! While you can use it for free, remember that republishing the code is subject to our House Rules.
Disclaimer
The information and publications are not meant to be, and do not constitute, financial, investment, trading, or other types of advice or recommendations supplied or endorsed by TradingView. Read more in the Terms of Use.