OPEN-SOURCE SCRIPT
Updated Multi timeframe Stochastic RSI Screener by noop42
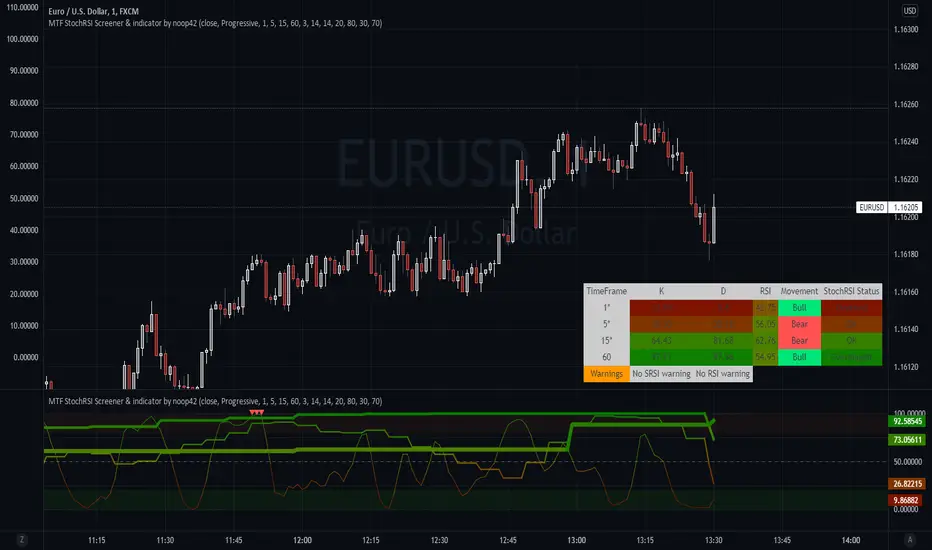
Here is a custom x4 timeframes Stochastic RSI screener to add on your charts.
Options
Default parameters
Notes
Use the lowest timeframe configured on the screener to get real values
A classic x3 multi-timeframe Stochastic RSI indicator is also available https://fr.tradingview.com/script/OwRzXzIb/
Options
- Repaint mode : if enabled: values are updated in live, if disabled: values are updated once the concerned candle is closed
Default parameters
- Timeframes: 1, 5, 15, 60
- Repaint mode: enabled
Notes
Use the lowest timeframe configured on the screener to get real values
A classic x3 multi-timeframe Stochastic RSI indicator is also available https://fr.tradingview.com/script/OwRzXzIb/
Release Notes
This update includes the indicator and the screener I previously developed.Updates:
- The oscillator prints the fourth timeframe which have already been included in the screener
- The screener is now including a warning field to show overbought/oversold signals convergence, which could indicate an incoming movement reversal (Warnings are calculated on the three lowest timeframes (the highest is ignored))
- Warnings are calculated on the three lowest timeframes (the highest is ignored)
- The screener can be disabled
- Overbought and Oversold signals are now based on the average value between K and D lines
- Up and Down triangles have been added to the oscillator to show OB/OS convergences
- Visual improvements
Note: This is an indicator, not a complete and trustable strategy
Hope you'll enjoy it :)
Release Notes
Updates- A column showing each timeframe's RSI value has been added to the screener
- Floating values have been limited to only 2 digits after the comma
- A second warning field concerning the three lowest timeframes' RSI have been added to show OB/OS convergences
Release Notes
Update- New option to select which timeframe(s) must be taken into consideration for convergence signals (Selected timeframes can be distinguished in the screener, followed by a * char in the timeframes column).
- If you plan to use the screener only and to move it on your main chart, you can now disable displays of stochastic rsi lines and zones. (thx to EtCrt for the idea)
Release Notes
Updates- A new color mode has been added. When enabled, it automatically apply the appropriate color from green to red (on the screener, and also on lines when the average mode is enabled). This is the new default color mode.
- Converted to Pinescript v5
Open-source script
In true TradingView spirit, the creator of this script has made it open-source, so that traders can review and verify its functionality. Kudos to the author! While you can use it for free, remember that republishing the code is subject to our House Rules.
Disclaimer
The information and publications are not meant to be, and do not constitute, financial, investment, trading, or other types of advice or recommendations supplied or endorsed by TradingView. Read more in the Terms of Use.