OPEN-SOURCE SCRIPT
Updated Buy and Sell Signals Based on SMI {K28}
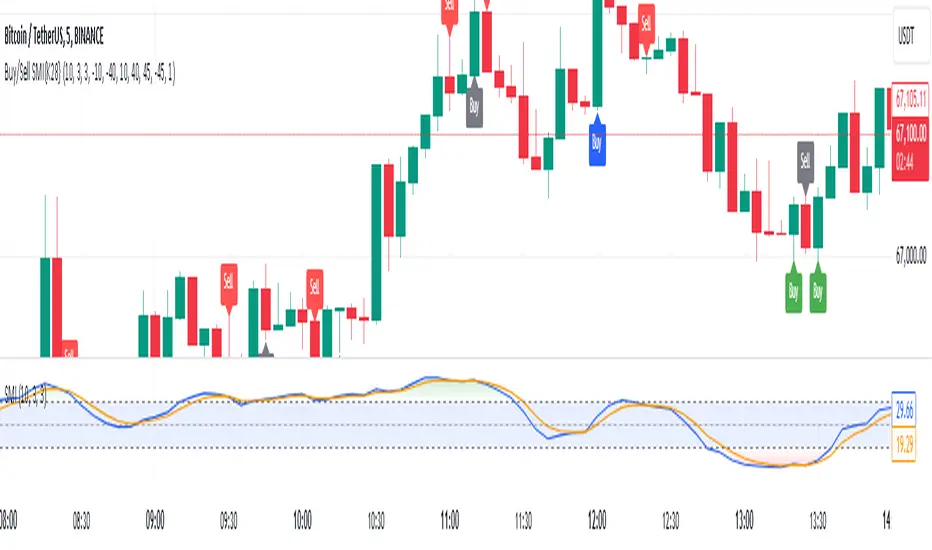
Buy/Sell Signals Based on SMI
This indicator provides buy and sell signals based on the Stochastic Momentum Index (SMI) to assist traders in identifying potential entry and exit points in the market. Here’s how to effectively use this indicator:
Usage Instructions:
Signal Interpretation:
No signal is 100% guaranteed
Green Labels: Indicate strong buy signals when the SMI crosses above its EMA, especially if the candle is green (closing price higher than opening price).
Red Labels: Indicate strong sell signals when the SMI crosses below its EMA.
Cautious Signals:
Blue Buy Labels: These buy signals appear when the SMI is in a cautious zone (between -20 and 20). They may not be as reliable, so confirm these signals with other indicators before acting.
Yellow Sell Labels: These buy signals appear when the SMI is in a cautious zone (between -20 and 20). They may not be as reliable, so confirm these signals with other indicators before acting.
Gray Buy and Sell Labels: Indicate potential false signals (when the SMI is overbought or oversold). Use other confirmation indicators to verify these signals.
Trade Strategy:
This indicator is designed for traders looking to make small, consistent profits. Focus on executing more trades rather than waiting for larger price movements.
Be mindful that the indicator may yield frequent signals, so it's essential to maintain discipline and only take trades that meet your criteria for confirmation.
Important Notes:
Caution with Signals: Always exercise caution when acting on blue or gray labels. These may indicate less reliable signals, so it's crucial to confirm with additional indicators.
No Perfect Indicator: Please remember that no trading indicator is perfect. Use this indicator at your own risk, and consider incorporating risk management strategies into your trading plan.
Conclusion:
By employing this SMI indicator, you can enhance your trading strategy focused on generating small, consistent profits through frequent trades. However, always verify signals and stay aware of market conditions to optimize your trading performance.
Release Notes
Additional NoteThis indicator is most effective in trending stocks, where clear uptrends or downtrends are present. It may produce false signals in sideways or range-bound markets, so be cautious and look for strong directional movement to increase the accuracy of signals.
Release Notes
Few fixesOpen-source script
In true TradingView spirit, the creator of this script has made it open-source, so that traders can review and verify its functionality. Kudos to the author! While you can use it for free, remember that republishing the code is subject to our House Rules.
Disclaimer
The information and publications are not meant to be, and do not constitute, financial, investment, trading, or other types of advice or recommendations supplied or endorsed by TradingView. Read more in the Terms of Use.
Open-source script
In true TradingView spirit, the creator of this script has made it open-source, so that traders can review and verify its functionality. Kudos to the author! While you can use it for free, remember that republishing the code is subject to our House Rules.
Disclaimer
The information and publications are not meant to be, and do not constitute, financial, investment, trading, or other types of advice or recommendations supplied or endorsed by TradingView. Read more in the Terms of Use.