OPEN-SOURCE SCRIPT
Stock Table aiTrendview
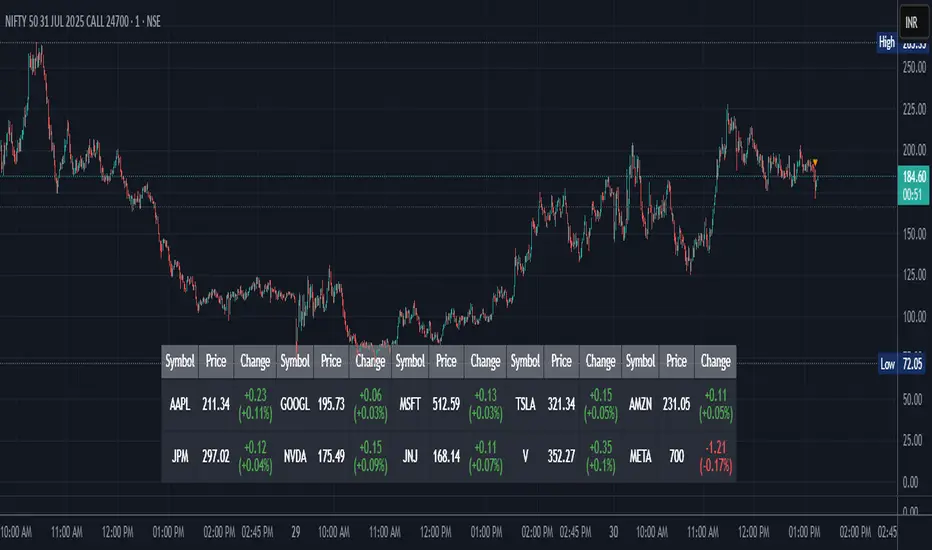
Professional Stock Market Monitoring Table (Pine Script v5)
This indicator is a real-time multi-asset monitoring table designed for professional traders, analysts, and portfolio managers using TradingView. Built with Pine Script v5, it enables users to track up to 10 instruments (stocks, indices, forex pairs, cryptocurrencies, or commodities) in a unified table embedded directly into the chart. It is intended to streamline portfolio monitoring, cross-market analysis, and rapid visual comparison of asset performance.
The core logic of this script involves retrieving live price data through TradingView’s request.security() function for each of the selected symbols. It calculates both absolute price change and percentage price change relative to the previous bar close. This ensures users can see real-time movements in each asset’s price. These calculations are updated at the close of every bar to optimize performance and reduce processing load using the barstate.islast condition.
The display structure is dynamically generated using table.new() and related functions. Internally, the script stores symbol and price data in arrays for efficient processing. Symbols are cleaned to remove exchange prefixes (e.g., "NASDAQ:", "BINANCE:") so only the ticker name is displayed. Based on the selected layout (1 to 5 columns), the table auto-adjusts its row structure to maintain clarity and symmetry. Each cell reflects the ticker symbol, current price, and changes, with conditional formatting applied to indicate price movement direction using green (positive), red (negative), or neutral colors.
Users can customize many visual elements including text size, color themes, transparency, table position, and whether headers are shown. The script includes built-in fallbacks for invalid symbols or empty data, ensuring robustness and uninterrupted performance during live market hours.
Use cases include:
Intraday traders monitoring multiple instruments simultaneously.
Swing traders assessing relative strength and correlation.
Portfolio managers scanning asset performance without switching charts.
Analysts preparing multi-asset presentations or watchlists.
To use the tool:
Paste the Pine Script into the Pine Editor.
Add the script to the chart.
Enter your desired symbols via the input fields.
Customize table position, layout, size, and color to suit your workspace.
This script does not provide trade signals or financial advice. It is purely a market visualization and data presentation tool. All calculations are based on live chart data and are synchronized with the chart’s timeframe.
Disclaimer from aiTrendview:
This script is a visual tool developed for market awareness and comparative observation. It does not constitute financial advice or guarantee trading results. aiTrendview and its affiliates are not responsible for any losses arising from decisions made based on this tool. All trading involves risk, and past performance is not indicative of future results. Always consult with a qualified financial advisor before making trading decisions.
Open-source script
In true TradingView spirit, the creator of this script has made it open-source, so that traders can review and verify its functionality. Kudos to the author! While you can use it for free, remember that republishing the code is subject to our House Rules.
Disclaimer
The information and publications are not meant to be, and do not constitute, financial, investment, trading, or other types of advice or recommendations supplied or endorsed by TradingView. Read more in the Terms of Use.