OPEN-SOURCE SCRIPT
GAP Bands
""
Introduction
Gap trading is a simple and disciplined approach to buying and shorting stocks. Essentially, one finds stocks that have a price gap from the previous close, then watches the first hour of trading to identify the trading range. Rising above that range signals a buy, while falling below it signals a short.
What is a Gap?
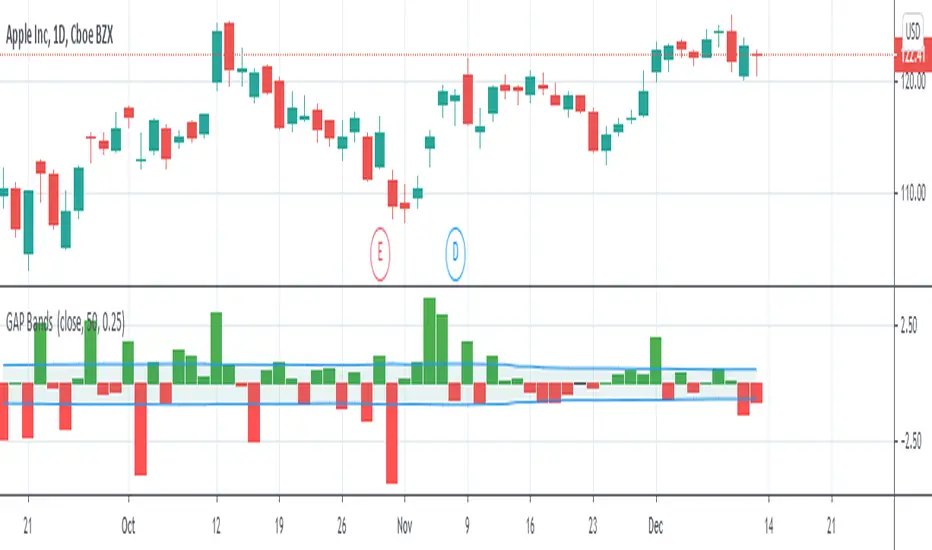
A gap is a change in price levels between the close and open of two consecutive days. Although most technical analysis manuals define the four types of gap patterns as Common, Breakaway, Continuation and Exhaustion, those labels are applied after the chart pattern is established. That is, the difference between any one type of gap from another is only distinguishable after the stock continues up or down in some fashion. Although those classifications are useful for a longer-term understanding of how a particular stock or sector reacts, they offer little guidance for trading.""" (Definition from StockCharts)
I plot gaps and add a band to them with volatility to make a decision about how important the current gap in terms of our price movement.
Introduction
Gap trading is a simple and disciplined approach to buying and shorting stocks. Essentially, one finds stocks that have a price gap from the previous close, then watches the first hour of trading to identify the trading range. Rising above that range signals a buy, while falling below it signals a short.
What is a Gap?
A gap is a change in price levels between the close and open of two consecutive days. Although most technical analysis manuals define the four types of gap patterns as Common, Breakaway, Continuation and Exhaustion, those labels are applied after the chart pattern is established. That is, the difference between any one type of gap from another is only distinguishable after the stock continues up or down in some fashion. Although those classifications are useful for a longer-term understanding of how a particular stock or sector reacts, they offer little guidance for trading.""" (Definition from StockCharts)
I plot gaps and add a band to them with volatility to make a decision about how important the current gap in terms of our price movement.
Open-source script
In true TradingView spirit, the creator of this script has made it open-source, so that traders can review and verify its functionality. Kudos to the author! While you can use it for free, remember that republishing the code is subject to our House Rules.
Disclaimer
The information and publications are not meant to be, and do not constitute, financial, investment, trading, or other types of advice or recommendations supplied or endorsed by TradingView. Read more in the Terms of Use.