OPEN-SOURCE SCRIPT
L&S Volatility Index
Overview
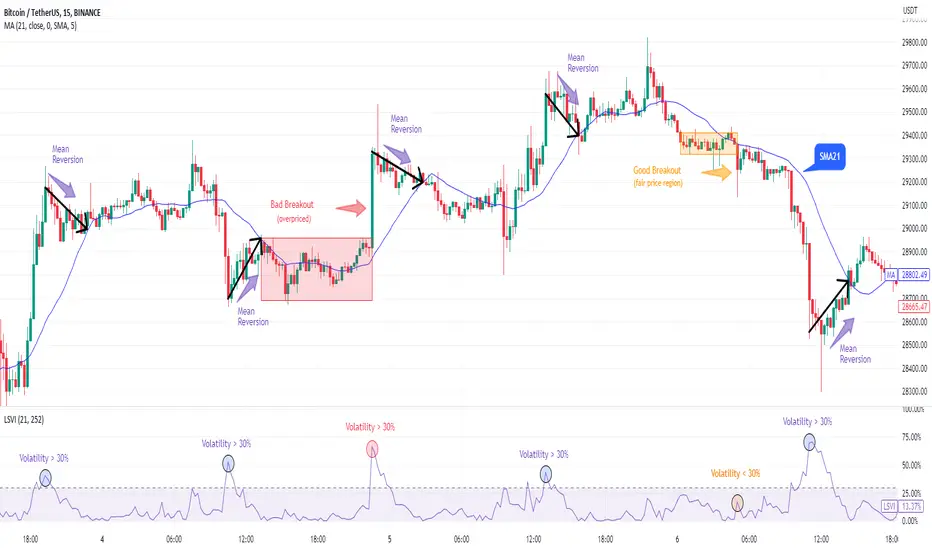
L&S Volatility Index is a tool designed to helps traders identify overpriced or underpriced moments in the market and adjust their trading strategies accordingly.
Calculations
This tool calculates how far the price is from the 21-period simple moving average as a ratio of the average historical volatility calculated over the last 21 candles.
How It Works
A L&S Volatility Index with a value greater than 30% may indicate that the asset is overpriced or underpriced relative to its average price.
How To Use
If the L&S Volatility Index > 30, the asset is overpriced or underpriced. This means that there is a good probability of initiating a mean reversion.
If the L&S Volatility Index < 30, the asset is in a fair price region. This means that it is acceptable to buy or sell in that price region.
Where To Use
Mean Reversion Strategy
Breakout Strategy
What Makes it Original
There is already an indicator that use a normalized calculation and a different approach to calculate historical volatility, whereas this script calculation is non-normalized and historical volatility is calculated using Don Fishback's formula. All calculations are used as originally described.
Credits
The L&S Volatility Index indicator was originally written by L&S Educação Financeira.
Historical Volatility calculation is based on the book "Odds: The Key to 90% Winners" written by Don Fishback.
Open-source script
In true TradingView spirit, the creator of this script has made it open-source, so that traders can review and verify its functionality. Kudos to the author! While you can use it for free, remember that republishing the code is subject to our House Rules.
Disclaimer
The information and publications are not meant to be, and do not constitute, financial, investment, trading, or other types of advice or recommendations supplied or endorsed by TradingView. Read more in the Terms of Use.