Blockunity Ultimatyx Oscillator (BUO)
The goal of this indicator is to give you an overview of the status of many indicators on different timeframes. It consists of a Screener and an Oscillator. The oscillator allows you to detect correlations between the indicators included in the Screener in order to give buy and sell points.
Usage Advice
There are no specific guidelines for this indicator. It works on all time units and all assets. We still recommend that you use your chart in logarithmic.
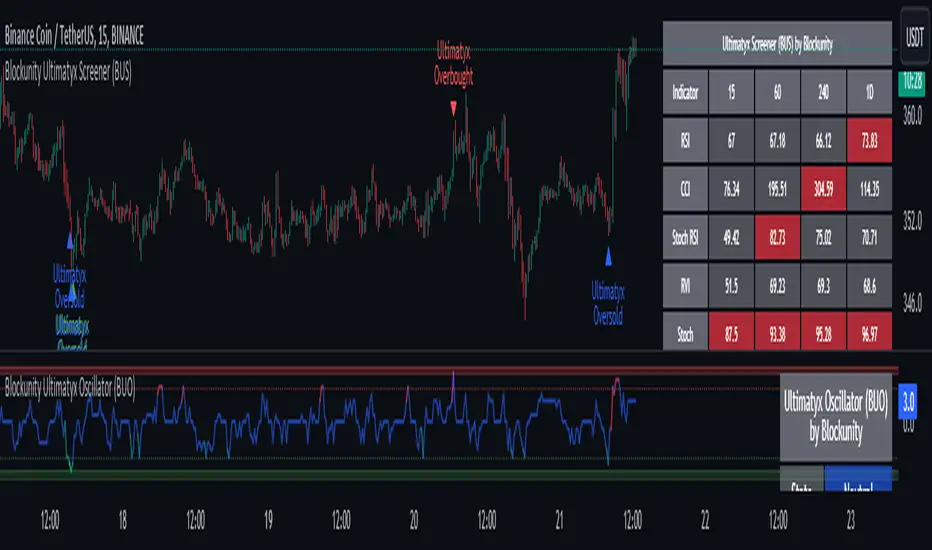
The Different Elements And Signals – The Screener
On your chart, you can find the Screener. It indicates the values of the following indicators:
- RSI (Relative Strength Index).
- CCI (Commodity Channel Index).
- Stoch RSI (Stochastic RSI).
- RVI (Relative Vigor Index).
- Stoch (Stochastic).
- TSI (True Strength Index).
- BB% (Bollinger Bands %B).
- %R (Williams Percent Range).
The background of each cell changes color if the indicator is oversold (green) or overbought (red).
In addition, it allows you to visualize all these values directly on several time units:
- Unit of the chart/the one you select.
- 1h.
- 4h.
- Daily.
- Weekly.
It is possible to change the time unit of the columns 1h, 4h, and Daily in the parameters. The first time unit column is dynamic and linked to the one you choose for your chart.
In addition, you will find directly on the chart the buy and sell points. By default, we display the « Ultimatyx » signals, which are a correlation of the different indicators present in the Screener. Of course, you are able to display the signals of your choice by modifying it in the « Style » tab of the indicator parameters.
The Different Elements And Signals – The Oscillator
The oscillator allows you to identify the moments of correlation between the different indicators of the Screener. Its color varies according to the number of indicators returning the same signal. These thresholds are configurable. The color code is as follows:
- Yellow: Heavily Oversold.
- Green: Oversold.
- Purple: Neutral.
- Red: Overbuy.
- Dark pink: Heavily Overbuy.
It's the oscillator that triggers the « Ultimatyx » signals.
- Replacement of the Rate Of Change (ROC) by the Stochastic RSI.
- Correction on the RVI and TSI plot.
- Added the following technical indicators in replacement of the SMA and EMA: Bollinger Bands % and Williams Percent Range.
- Added limits and zones on the oscillator. It is possible to disable these elements in the parameters.
- Buy/Sell signals changed to Overbought/Oversold.
- Added a mechanism for determining volatility.
- If volatility is considered too high, signals are displayed in blue. In this case, you need to be more cautious in interpreting them, because when volatility is too high, overbought and oversold signals may be given a bit early.
- Reduced table transparency for better compatibility with White Mode.
- Change of some oscillator colors for better visualization in both modes (Dark & White).
- New data table design. Moreover, it is now fully configurable.
- A few other design adjustments.
- Some parameter values are now hidden for better readability.
- Added a version number at the end of the parameters.
- Inversion of the oscillator's buy and sell zones for improved clarity.
- Strong overbought or oversold signal.
Invite-only script
Only users authorized by the author have access to this script, and this usually requires payment. You can add the script to your favorites, but you will only be able to use it after requesting permission and obtaining it from its author — learn more here. For more details, follow the author's instructions below or contact Blockunity directly.
Note that this private, invite-only script has not been reviewed by script moderators, and its compliance with House Rules is undetermined. TradingView does NOT recommend paying for or using a script unless you fully trust its author and understand how it works. You may also find free, open-source alternatives in our community scripts.
Author's instructions
Warning: please read our guide for invite-only scripts before requesting access.
app.blockunity.io/
unyx-data.com/
contact@blockunity.io
Disclaimer
Invite-only script
Only users authorized by the author have access to this script, and this usually requires payment. You can add the script to your favorites, but you will only be able to use it after requesting permission and obtaining it from its author — learn more here. For more details, follow the author's instructions below or contact Blockunity directly.
Note that this private, invite-only script has not been reviewed by script moderators, and its compliance with House Rules is undetermined. TradingView does NOT recommend paying for or using a script unless you fully trust its author and understand how it works. You may also find free, open-source alternatives in our community scripts.
Author's instructions
Warning: please read our guide for invite-only scripts before requesting access.
app.blockunity.io/
unyx-data.com/
contact@blockunity.io