OPEN-SOURCE SCRIPT
BS with Period
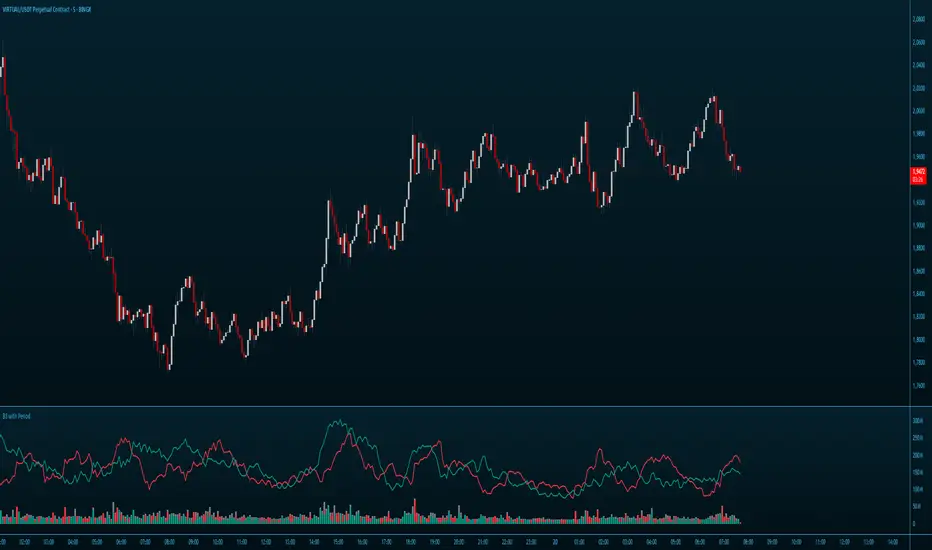
The “BS with Period” indicator visualizes the balance between buying and selling volume within each candle, and also tracks those volumes accumulated over a specified number of bars.
It first splits a candle’s total volume into two parts based on where the close sits: the closer the close is to the high, the larger the “buying” portion; the closer it is to the low, the larger the “selling” portion. This means that for any given volume you can see whether buyers or sellers were more active.
On the chart you see three column plots:
Gray for total volume
Red for the portion attributed to selling
Teal for the portion attributed to buying
Optionally, it also sums those buying and selling volumes over the last N bars and plots them as two lines. This gives you a medium-term view of which side is dominating: if the buying-volume line stays well above the selling-volume line, buyers are in control, and vice versa.
Traders use it to:
Spot sustained buying or selling pressure when one accumulated-volume line pulls ahead of the other.
Confirm trend accelerations or potential reversals when the balance shifts.
Adjust sensitivity by choosing a shorter period (more responsive, but noisier) or a longer period (smoother, but slower).
Overall, the indicator helps quantify the internal volume structure and the tug-of-war between buyers and sellers both within each candle and over your chosen look-back period.
Open-source script
In true TradingView spirit, the creator of this script has made it open-source, so that traders can review and verify its functionality. Kudos to the author! While you can use it for free, remember that republishing the code is subject to our House Rules.
Disclaimer
The information and publications are not meant to be, and do not constitute, financial, investment, trading, or other types of advice or recommendations supplied or endorsed by TradingView. Read more in the Terms of Use.