OPEN-SOURCE SCRIPT
Stochastic [Tcs] | OSC
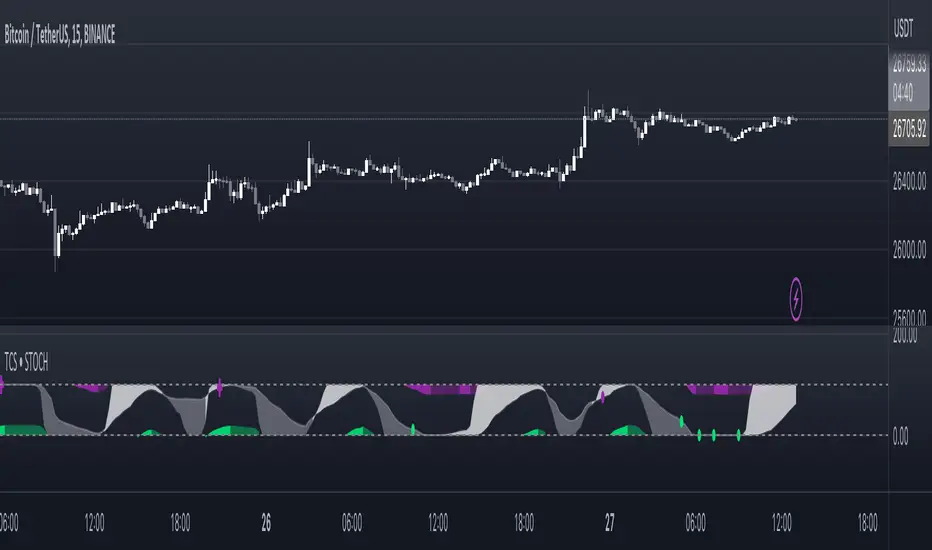
This script is an implementation of the stochastic relative strength index (STOCH RSI) indicator
The script takes inputs from the length of the RSI, the source of the data, and parameters for the smoothing of the STOCH RSI.
The STOCH RSI is calculated by first calculating the RSI of the chosen source data, then smoothing it with an exponential moving average. The stochastic oscillator is then applied to the smoothed RSI, and smoothed again to create the final STOCH RSI.
The script also calculates a trigger value using a combination of the STOCH RSI and a volume-weighted moving average. It then plots the STOCH RSI, trigger value, and overbought/oversold levels, and fills the background of the plot based on the relationship between the trigger and STOCH RSI values.
Finally, the script plots buy and sell signals based on crossovers and crossunders of the STOCH RSI and its smoothed version.
The cross signal is stronger than the dots, in both direction and usually the best entries happen when two crosses signal on the level 0(long) or 100(short) appear after a dot signal.

Please note that this indicator is for educational purposes only and should not be used for trading without further testing and analysis.
The script takes inputs from the length of the RSI, the source of the data, and parameters for the smoothing of the STOCH RSI.
The STOCH RSI is calculated by first calculating the RSI of the chosen source data, then smoothing it with an exponential moving average. The stochastic oscillator is then applied to the smoothed RSI, and smoothed again to create the final STOCH RSI.
The script also calculates a trigger value using a combination of the STOCH RSI and a volume-weighted moving average. It then plots the STOCH RSI, trigger value, and overbought/oversold levels, and fills the background of the plot based on the relationship between the trigger and STOCH RSI values.
Finally, the script plots buy and sell signals based on crossovers and crossunders of the STOCH RSI and its smoothed version.
The cross signal is stronger than the dots, in both direction and usually the best entries happen when two crosses signal on the level 0(long) or 100(short) appear after a dot signal.
Please note that this indicator is for educational purposes only and should not be used for trading without further testing and analysis.
Open-source script
In true TradingView spirit, the creator of this script has made it open-source, so that traders can review and verify its functionality. Kudos to the author! While you can use it for free, remember that republishing the code is subject to our House Rules.
For the access to premium indicators please contact me on tradingview
Disclaimer
The information and publications are not meant to be, and do not constitute, financial, investment, trading, or other types of advice or recommendations supplied or endorsed by TradingView. Read more in the Terms of Use.