PROTECTED SOURCE SCRIPT
Updated Harmonic Patterns - Custom Candles
Hello Traders,
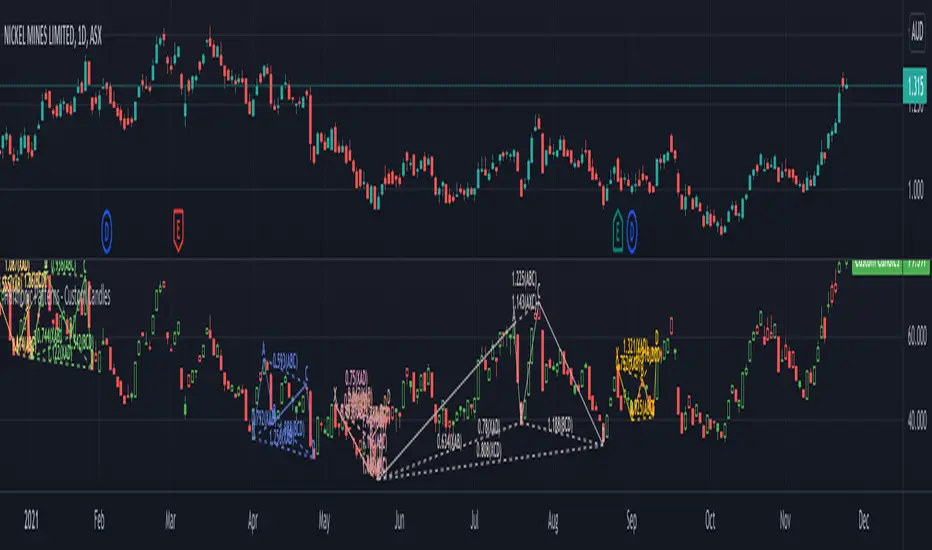
Here is an experimental indicator created to plot harmonic patterns on indicators. This can be used for confirmation of oversold and overbought regions. However please note that oscillator movements does not always correlate with price movements. Hence, there was no concrete way to log the trade statistics and measure performance.
⬜ Process
▶ Derive custom candles
There are two types of candles used in this script
▶ Draw zigzag
Single zigzag is used in this indicator. However, multiple zigzags can also be used.
▶ Apply harmonic pattern calculations
Use the logical calculations to derive harmonic patterns.
More experiments need to be done on using the indicator along with regular harmonic patterns on chart.
https://tradingview.sweetlogin.com/x/2cZCz1JC/
Here is an experimental indicator created to plot harmonic patterns on indicators. This can be used for confirmation of oversold and overbought regions. However please note that oscillator movements does not always correlate with price movements. Hence, there was no concrete way to log the trade statistics and measure performance.
⬜ Process
▶ Derive custom candles
There are two types of candles used in this script
- Oscillator Candles - derived based on oscillators - cci, cmo, cog, mfi, roc and rsi.
- Band Candles - Candles derived based on percentage range of Bands. Available options - Bollinger Bands, Keltner Channel and Donchian Channel
▶ Draw zigzag
Single zigzag is used in this indicator. However, multiple zigzags can also be used.
▶ Apply harmonic pattern calculations
Use the logical calculations to derive harmonic patterns.
More experiments need to be done on using the indicator along with regular harmonic patterns on chart.
https://tradingview.sweetlogin.com/x/2cZCz1JC/
Release Notes
update to eHarmonic patternsProtected script
This script is published as closed-source. However, you can use it freely and without any limitations – learn more here.
Trial - trendoscope.io/trial
Subscribe - trendoscope.io/pricing
Blog - docs.trendoscope.io
Subscribe - trendoscope.io/pricing
Blog - docs.trendoscope.io
Disclaimer
The information and publications are not meant to be, and do not constitute, financial, investment, trading, or other types of advice or recommendations supplied or endorsed by TradingView. Read more in the Terms of Use.
Protected script
This script is published as closed-source. However, you can use it freely and without any limitations – learn more here.
Trial - trendoscope.io/trial
Subscribe - trendoscope.io/pricing
Blog - docs.trendoscope.io
Subscribe - trendoscope.io/pricing
Blog - docs.trendoscope.io
Disclaimer
The information and publications are not meant to be, and do not constitute, financial, investment, trading, or other types of advice or recommendations supplied or endorsed by TradingView. Read more in the Terms of Use.