OPEN-SOURCE SCRIPT
Stochastic ATR Volatility Oscillator
NOTES: As x, k and d use;
21-10-3 for 1 Hour candles
5-4-2 for 4 Hour candles
21-21-3 for 1 Day candles
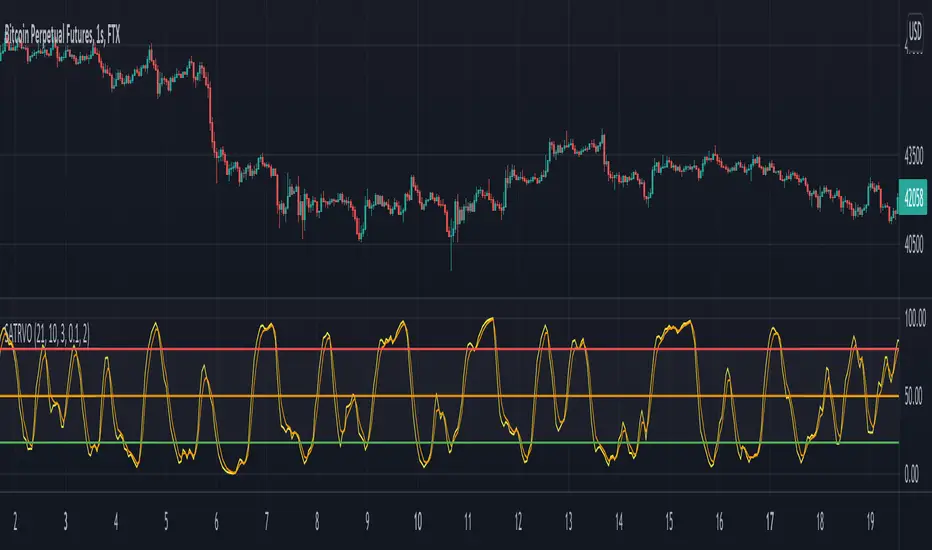
Yellow plot is the main oscillator. Orange plot, and hlines at 20, 50 and 80 can be used as signal lines.
I personally use hlines as the signal in 1H as it's the best timeframe for the indicator.
If you are in a long position, sell when yellow plot crosses 80 or 50 line downwards;
and buy when the line crosses 20, 50 or 75 upwards while you are not in a trade.
21-10-3 for 1 Hour candles
5-4-2 for 4 Hour candles
21-21-3 for 1 Day candles
Yellow plot is the main oscillator. Orange plot, and hlines at 20, 50 and 80 can be used as signal lines.
I personally use hlines as the signal in 1H as it's the best timeframe for the indicator.
If you are in a long position, sell when yellow plot crosses 80 or 50 line downwards;
and buy when the line crosses 20, 50 or 75 upwards while you are not in a trade.
Open-source script
In true TradingView spirit, the creator of this script has made it open-source, so that traders can review and verify its functionality. Kudos to the author! While you can use it for free, remember that republishing the code is subject to our House Rules.
Disclaimer
The information and publications are not meant to be, and do not constitute, financial, investment, trading, or other types of advice or recommendations supplied or endorsed by TradingView. Read more in the Terms of Use.