OPEN-SOURCE SCRIPT
Updated FIBI
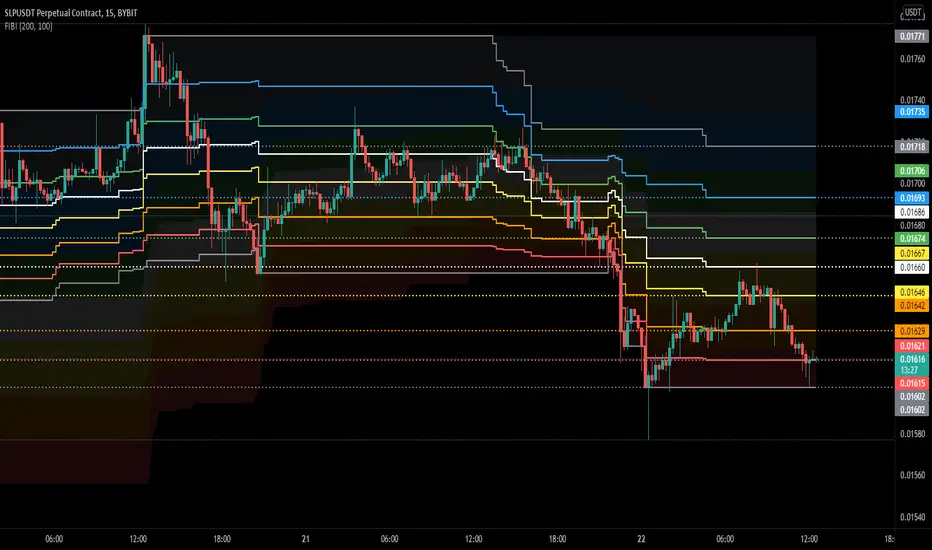
Shows Fibonacci waves for a long range and Fibonacci lines for a short range.
For me it helps to identify key levels or confluence on the macro and micro range.
In the example above you can clearly see that the macro waves are in a down-trend while the micro lines are in a up-trend..
Also the price has been rejected at the 78.6 fib mirco line but found support on the 78.6 macro wave.
these situations are hard to find with the default retracement tools
Release Notes
Code clean upRelease Notes
Using bands instead of areaRelease Notes
Chart updatedRelease Notes
Added 23.6 FIBOpen-source script
In true TradingView spirit, the creator of this script has made it open-source, so that traders can review and verify its functionality. Kudos to the author! While you can use it for free, remember that republishing the code is subject to our House Rules.
Disclaimer
The information and publications are not meant to be, and do not constitute, financial, investment, trading, or other types of advice or recommendations supplied or endorsed by TradingView. Read more in the Terms of Use.
Open-source script
In true TradingView spirit, the creator of this script has made it open-source, so that traders can review and verify its functionality. Kudos to the author! While you can use it for free, remember that republishing the code is subject to our House Rules.
Disclaimer
The information and publications are not meant to be, and do not constitute, financial, investment, trading, or other types of advice or recommendations supplied or endorsed by TradingView. Read more in the Terms of Use.