OPEN-SOURCE SCRIPT
Rachas ATR Assist
Hey Traders!
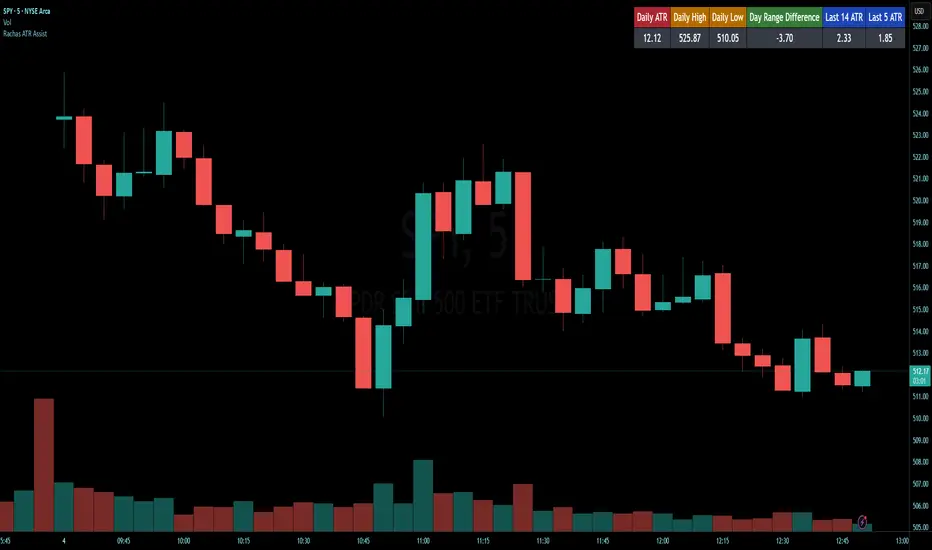
This indicator is a simple, it uses Average True Range (ATR) data from the daily chart and the current timeframe to estimate potential range and volatility.
This indicator compares the daily ATR to the current daily wick range (from low to high), helping you gauge how much "room" might be left for price movement within the day. Alongside that, it shows the ATR over the last 14 candles and 5 candles on your current chart for intraday volatility awareness—ideal for setting stops, targets, or position sizing.
Gauge Daily Potential Movement:
The "Day Range Difference" cell shows how much of the expected daily range (based on ATR) is still unfilled. If the market has moved less than the average, there's still potential for expansion. If it's close to or above the ATR, expect a slowdown or reversal.
Position Sizing & Stop Losses:
Use the 14-period ATR and 5-period ATR on your current timeframe to understand recent volatility. This helps in choosing logical stop loss levels and adjusting position sizes based on market conditions.
Volatility Awareness:
Knowing the average daily range and how much of it has been used lets you avoid entering trades too late in the move or placing stops in overly tight spots.
Table Position & Font:
You can adjust the table location (top/bottom left/right) and font size to best fit your chart layout.
Open-source script
In true TradingView spirit, the creator of this script has made it open-source, so that traders can review and verify its functionality. Kudos to the author! While you can use it for free, remember that republishing the code is subject to our House Rules.
Disclaimer
The information and publications are not meant to be, and do not constitute, financial, investment, trading, or other types of advice or recommendations supplied or endorsed by TradingView. Read more in the Terms of Use.