OPEN-SOURCE SCRIPT
Historical Volatility Study
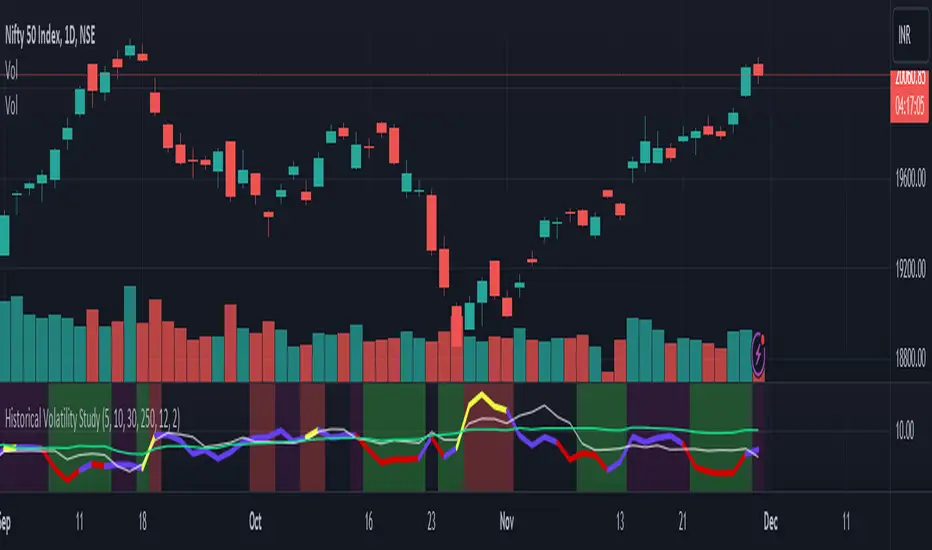
The goal of this script it to provide you an idea to forecast the future momentum by looking at historical volatility.
This chart has basically three parts.
1. Three lines are there. The multi color line represents the historical annualized volatility in terms of minimum look back period . The white line represents the historical annualized volatility in terms of medium term look back period . The green line represents the historical annualized volatility in terms of longer term look back period .

2. The back ground color has three components. Green zone is the zone where overall volatility is on the lower side. Red zone is the zone where overall volatility is on the higher side. Purple zone means fluctuating volatility.

3. The multi color line has three colors. Red color means volatility moving towards extreme low. Yellow means it is moving towards extreme high. Purple means it is in normal course of action.
This tool can be used as a confirmation tool with other studies to aid you to make better decisions. For example- look at the diagram below.

Make your thorough study before making any trading decision. Thanks.
This chart has basically three parts.
1. Three lines are there. The multi color line represents the historical annualized volatility in terms of minimum look back period . The white line represents the historical annualized volatility in terms of medium term look back period . The green line represents the historical annualized volatility in terms of longer term look back period .
2. The back ground color has three components. Green zone is the zone where overall volatility is on the lower side. Red zone is the zone where overall volatility is on the higher side. Purple zone means fluctuating volatility.
3. The multi color line has three colors. Red color means volatility moving towards extreme low. Yellow means it is moving towards extreme high. Purple means it is in normal course of action.
This tool can be used as a confirmation tool with other studies to aid you to make better decisions. For example- look at the diagram below.
Make your thorough study before making any trading decision. Thanks.
Open-source script
In true TradingView spirit, the creator of this script has made it open-source, so that traders can review and verify its functionality. Kudos to the author! While you can use it for free, remember that republishing the code is subject to our House Rules.
Disclaimer
The information and publications are not meant to be, and do not constitute, financial, investment, trading, or other types of advice or recommendations supplied or endorsed by TradingView. Read more in the Terms of Use.