OPEN-SOURCE SCRIPT
[c3s] CWS - M2 Global Liquidity Index & BTC Correlation
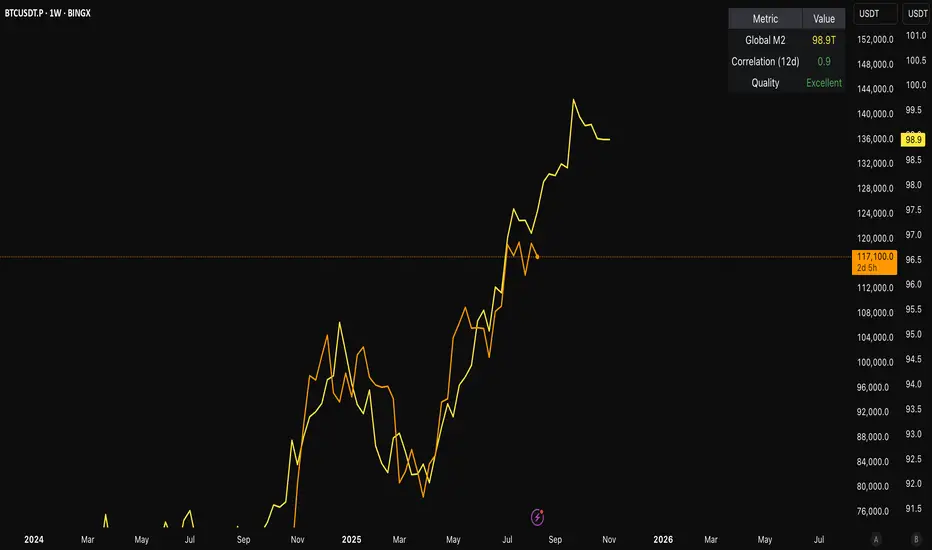
[c3s] CWS - M2 Global Liquidity Index with Offset BTC Correlation
This custom indicator visualizes and analyzes the relationship between the global M2 money supply and Bitcoin (BTC) price movements. It calculates the correlation between these two variables to provide insights into how changes in global liquidity may impact Bitcoin’s price over time.
Key Features:
Inputs:
Usage:
Ideal for traders and analysts seeking to understand the relationship between global liquidity and Bitcoin price. The offset and lookback period can be adjusted to explore different timeframes and correlation strengths, aiding more informed trading decisions.
This custom indicator visualizes and analyzes the relationship between the global M2 money supply and Bitcoin (BTC) price movements. It calculates the correlation between these two variables to provide insights into how changes in global liquidity may impact Bitcoin’s price over time.
Key Features:
- Global M2 Liquidity Index Calculation:
Fetches M2 money supply data from multiple economies (China, US, EU, Japan, UK) and normalizes using currency exchange rates (e.g., CNY/USD, EUR/USD).
Combines all M2 data points and normalizes by dividing by 1 trillion (1e12) for easier visualization. - Offset for M2 Data:
The offset parameter allows users to shift the M2 data by a specified number of days, helping track the influence of past global liquidity on Bitcoin. - BTC Price Correlation:
Computes the correlation between shifted global M2 liquidity and Bitcoin (BTC) price, using a 52-day lookback period by default. - Correlation Quality Display:
Categorizes correlation quality as:
Excellent: Correlation >= 0.8
Good: Correlation >= 0.6 and < 0.8
Weak: Correlation >= 0.4 and < 0.6
Very Weak: Correlation < 0.4
Displays correlation quality as a label on the chart for easy assessment. - Visual Enhancements:Labels: Displays dynamic labels on the chart with metrics like M2 value and correlation.
Plot Shapes: Uses shapes to indicate data availability for global M2 and correlation.
Data Table: Optionally shows a data table in the top-right corner summarizing:
Global M2 value (in trillions)
The correlation between global M2 and BTC
The correlation quality - Optional Debugging:Debug plots help identify when data is missing for M2 or correlation, ensuring transparency and accurate functionality.
Inputs:
- []Offset: Shift the M2 data (in days) to see past liquidity effects on Bitcoin.
[]Lookback Period: Number of periods (default 52) used to calculate the correlation.
[]Show Labels: Toggle to show or hide labels for M2 and correlation values.
[]Show Table: Toggle to show or hide the data table in the top-right corner.
Usage:
Ideal for traders and analysts seeking to understand the relationship between global liquidity and Bitcoin price. The offset and lookback period can be adjusted to explore different timeframes and correlation strengths, aiding more informed trading decisions.
Open-source script
In true TradingView spirit, the creator of this script has made it open-source, so that traders can review and verify its functionality. Kudos to the author! While you can use it for free, remember that republishing the code is subject to our House Rules.
Disclaimer
The information and publications are not meant to be, and do not constitute, financial, investment, trading, or other types of advice or recommendations supplied or endorsed by TradingView. Read more in the Terms of Use.