OPEN-SOURCE SCRIPT
Updated ICT Time Capture
ICT 8am High/Low + 9am Capture (NY Time) — Fixed 1H
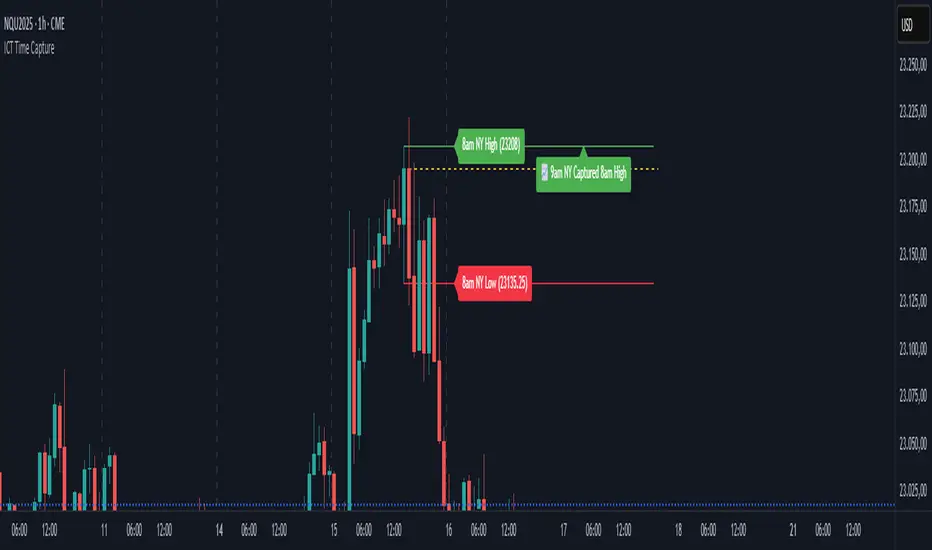
This indicator marks the High and Low of the 8am candle on the 1-hour timeframe fixed to New York time (America/New_York timezone). It also draws a line for the 9am candle open and indicates if the 9am candle “captured” (broke above or below) the 8am High or Low.
Key Features:
Always uses 1-hour data fixed on New York timezone, regardless of the chart’s current timeframe.
Draws horizontal lines for the 8am High and Low, with configurable colors, styles (solid/dashed), thickness, and extension length.
Draws a horizontal line for the 9am open price with customizable style.
Shows labels with price values explaining the lines.
Shows a capture label when the 9am candle breaks above the 8am high or below the 8am low.
Allows full customization of label text colors, line colors, line styles, thickness, and label distances from line start.
How to use:
Use this indicator to monitor key ICT timeframes (8am and 9am NY time) for intraday price action clues.
The capture labels help identify when price breaks key levels from the 8am candle during the 9am candle.
The configurable style options let you customize the indicator to your chart style.
Release Notes
Fix options.Open-source script
In true TradingView spirit, the creator of this script has made it open-source, so that traders can review and verify its functionality. Kudos to the author! While you can use it for free, remember that republishing the code is subject to our House Rules.
Disclaimer
The information and publications are not meant to be, and do not constitute, financial, investment, trading, or other types of advice or recommendations supplied or endorsed by TradingView. Read more in the Terms of Use.
Open-source script
In true TradingView spirit, the creator of this script has made it open-source, so that traders can review and verify its functionality. Kudos to the author! While you can use it for free, remember that republishing the code is subject to our House Rules.
Disclaimer
The information and publications are not meant to be, and do not constitute, financial, investment, trading, or other types of advice or recommendations supplied or endorsed by TradingView. Read more in the Terms of Use.