OPEN-SOURCE SCRIPT
Bullish Breakaway V2 (Publish)-FVG concept
This is my Version 2 of the breakaway indicator based o the FVP concept.
In this version 2, I have session pre-set, ETH vs RTH, and your own session of choice ( The default setting is only for CME future product in New York timezone ).
ETH session is from 1800 to 1645.
RTH session is from 930 to 1645.
I have to end at 1645, so the data will reset at each day.
If you don't see anything on the screen, that is because you are not in an active session, so you should use replay to see the indicator.
This indicator will only work best at 1m, 5m, and 15m, if you use end time at 1645.
You may have to adjust the session time for stock product RTH vs ETH. I have not tried stock yet.
Version 2 has advanced display feature using shade, and a counter to count how many breakaway candle are in the chart.

There are several ways to use this indicator to help you trade.
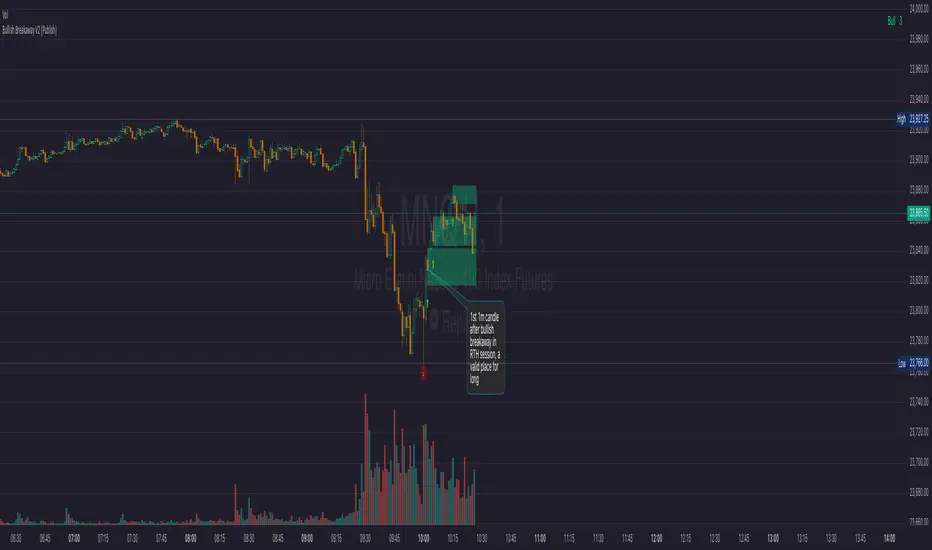
In this chart 8-15-2025 NQ, you can see the 1st breakaway bullish direction formed at 1002am, if you long at 1003, you have enough space for a profitable trade in the long direction.
Notice if you even enter the low of the 2nd breakaway bullish candle, you still have room for profit in the long direction. You need to get comfortable about this trading experience. Basically you want to wait for the 1st bullish breakaway candle to form before you go for a long trade.
In this version 2, I have session pre-set, ETH vs RTH, and your own session of choice ( The default setting is only for CME future product in New York timezone ).
ETH session is from 1800 to 1645.
RTH session is from 930 to 1645.
I have to end at 1645, so the data will reset at each day.
If you don't see anything on the screen, that is because you are not in an active session, so you should use replay to see the indicator.
This indicator will only work best at 1m, 5m, and 15m, if you use end time at 1645.
You may have to adjust the session time for stock product RTH vs ETH. I have not tried stock yet.
Version 2 has advanced display feature using shade, and a counter to count how many breakaway candle are in the chart.
There are several ways to use this indicator to help you trade.
In this chart 8-15-2025 NQ, you can see the 1st breakaway bullish direction formed at 1002am, if you long at 1003, you have enough space for a profitable trade in the long direction.
Notice if you even enter the low of the 2nd breakaway bullish candle, you still have room for profit in the long direction. You need to get comfortable about this trading experience. Basically you want to wait for the 1st bullish breakaway candle to form before you go for a long trade.
Open-source script
In true TradingView spirit, the creator of this script has made it open-source, so that traders can review and verify its functionality. Kudos to the author! While you can use it for free, remember that republishing the code is subject to our House Rules.
Disclaimer
The information and publications are not meant to be, and do not constitute, financial, investment, trading, or other types of advice or recommendations supplied or endorsed by TradingView. Read more in the Terms of Use.