OPEN-SOURCE SCRIPT
Wick to Candle Ratio with Multiple Colors
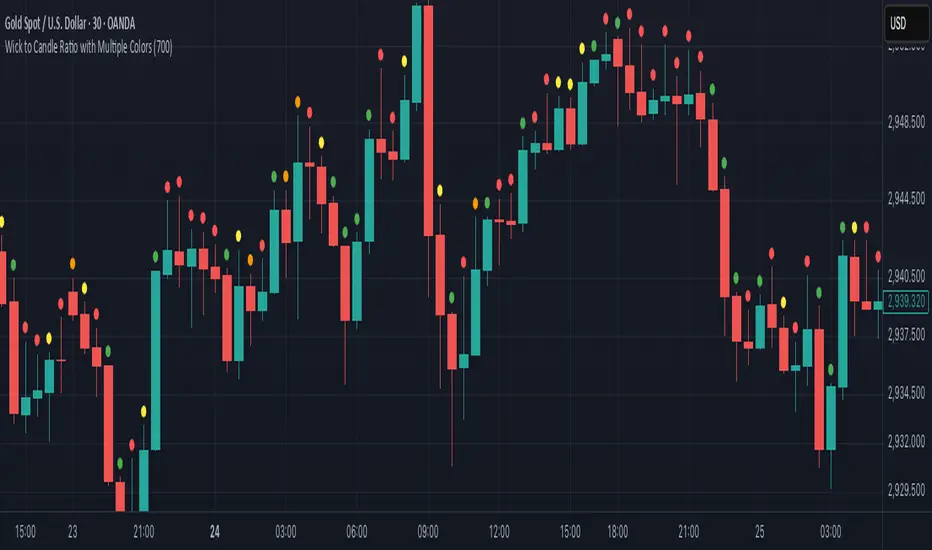
The display in question likely provides visual representations or data related to the concept of the dot-based wick-to-body ratio. This ratio is a term often used in financial markets, particularly in the context of candlestick charts.
In candlestick charts, each candlestick represents a specific time period (such as a minute, hour, day, etc.) and provides four pieces of price data: the opening price, closing price, highest price, and lowest price of an asset within that timeframe. The "body" of the candlestick is the area between the opening and closing prices, while the "wicks" (or shadows) are the lines extending from the body, representing the highest and lowest prices during the period.
The dot-based wick-to-body ratio refers to a method of quantifying the relative lengths of the wicks compared to the body using dots or points. In this context, a display illustrating this ratio might show different candlesticks with highlighted dots representing the ratio between the length of the wick and the body. A higher ratio could indicate more volatility in price movements during that timeframe, while a lower ratio might suggest comparatively stable price action.
Open-source script
In true TradingView spirit, the creator of this script has made it open-source, so that traders can review and verify its functionality. Kudos to the author! While you can use it for free, remember that republishing the code is subject to our House Rules.
Disclaimer
The information and publications are not meant to be, and do not constitute, financial, investment, trading, or other types of advice or recommendations supplied or endorsed by TradingView. Read more in the Terms of Use.