OPEN-SOURCE SCRIPT
Average Deviation Bands (ADB)
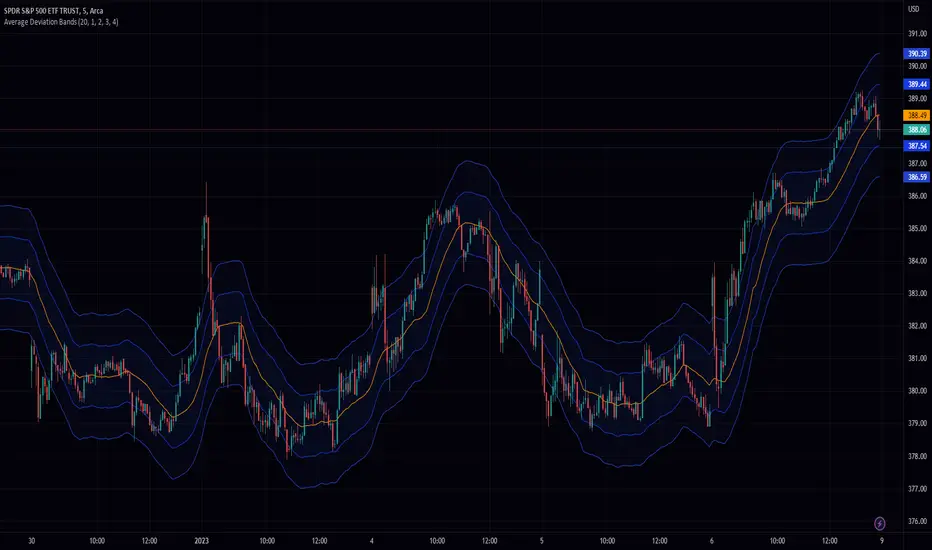
The Average Deviation Bands indicator is a technical analysis tool that plots multiple bands around the average price of an asset. These bands are calculated using the standard deviation of the asset's price over a specified time period, as well as the average price of the asset over the same period. However, it's important to note that the standard deviation is only calculated for the specified time period leading up to the current point in the data set. The indicator then takes the average of all of these standard deviation values to plot the bands. The number and width of the bands can be customized by the user. The bands can be used to identify potential trend changes and to assess the volatility of the asset. The indicator is often used in combination with other technical analysis tools to provide a more complete picture of market conditions.
Open-source script
In true TradingView spirit, the creator of this script has made it open-source, so that traders can review and verify its functionality. Kudos to the author! While you can use it for free, remember that republishing the code is subject to our House Rules.
Here are some ways you can contact me:
Toll-Free: +1(800)250-1992
Discord: hikari0001
Telegram: t.me/Jessesanford
Email: info@peaceful.trade
Toll-Free: +1(800)250-1992
Discord: hikari0001
Telegram: t.me/Jessesanford
Email: info@peaceful.trade
Disclaimer
The information and publications are not meant to be, and do not constitute, financial, investment, trading, or other types of advice or recommendations supplied or endorsed by TradingView. Read more in the Terms of Use.