OPEN-SOURCE SCRIPT
Updated The Adam Khoo Magic
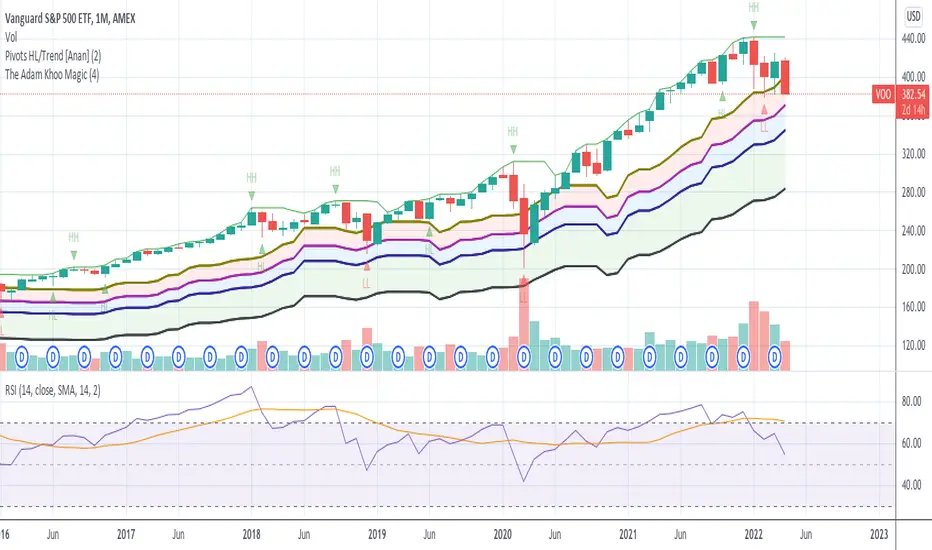
Totally inspired by Adam Khoo's analogy
This is meant for the monthly bar:
Where you try to find the highest point of the average recession/correction time to the bottom:
average correction time to bottom: 4.2months
average bear market time to bottom: 13months (default)
Plot/Fill chart with the 4 tranches recommended:
-8%, -15%, -21% and -35% to gauge entry point
Release Notes
Changed that hardcoded timeframe to follow the dynamic highlengthOpen-source script
In true TradingView spirit, the creator of this script has made it open-source, so that traders can review and verify its functionality. Kudos to the author! While you can use it for free, remember that republishing the code is subject to our House Rules.
Disclaimer
The information and publications are not meant to be, and do not constitute, financial, investment, trading, or other types of advice or recommendations supplied or endorsed by TradingView. Read more in the Terms of Use.
Open-source script
In true TradingView spirit, the creator of this script has made it open-source, so that traders can review and verify its functionality. Kudos to the author! While you can use it for free, remember that republishing the code is subject to our House Rules.
Disclaimer
The information and publications are not meant to be, and do not constitute, financial, investment, trading, or other types of advice or recommendations supplied or endorsed by TradingView. Read more in the Terms of Use.