OPEN-SOURCE SCRIPT
Litecoin LTC Logarithmic Fibonacci Growth Curves
HOW THIS SCRIPT IS ORIGINAL: there is no similar script dedicated to LTC, although there are similar ones dedicated to BTC. (This was created by modifying an old public and open source similar script dedicated to BTC.)
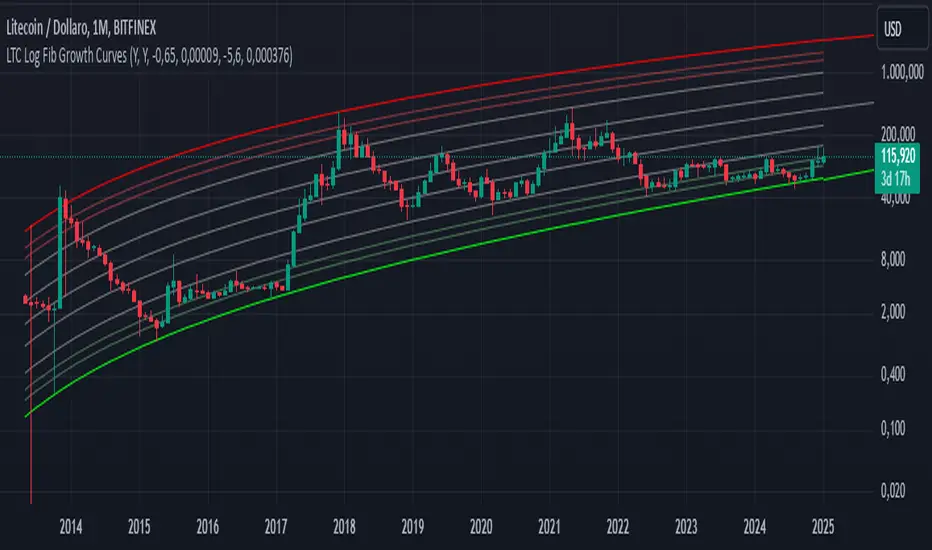
WHAT THIS SCRIPT DOES: draws a channel containing the price of LTC within which the Fibonacci extensions are highlighted. The reference chart to use is LTC/USD on Bitfinex (because it has the oldest data, given that Tradingview has not yet created an LTC index), suggested with weekly or monthly timeframe.
HOW IT DOES IT: starting from two basic curves that average the upper and lower peaks of the price, the relative Fibonacci extensions are then built on the basis of these: 0.9098, 0.8541, 0.7639, 0.618, 0.5, 0.382, 0.2361, 0.1459, 0.0902.
HOW TO USE IT: after activating the script you will notice the presence of two areas of particular interest, the upper area, delimited in red, which follows the upper peaks of the price, and the lower area, delimited in green, which follows the lower peaks of the price. Furthermore, the main curves, namely the two extremes and the median, are also projected into the future to predict an indicative trend. This script is therefore useful for understanding where the price will go in the future and can be useful for understanding when to buy (near the green lines) or when to sell (near the red lines). It is also possible to configure the script by choosing the colors and types of lines, as well as the main parameters to define the upper and lower curve, from which the script deduces all the other lines that are in the middle.
Very easy to read and interpret. I hope this description is sufficient, but it is certainly easier to use it than to describe it.
Open-source script
In true TradingView spirit, the creator of this script has made it open-source, so that traders can review and verify its functionality. Kudos to the author! While you can use it for free, remember that republishing the code is subject to our House Rules.
Disclaimer
The information and publications are not meant to be, and do not constitute, financial, investment, trading, or other types of advice or recommendations supplied or endorsed by TradingView. Read more in the Terms of Use.