OPEN-SOURCE SCRIPT
Multi-Timeframe RSI Table
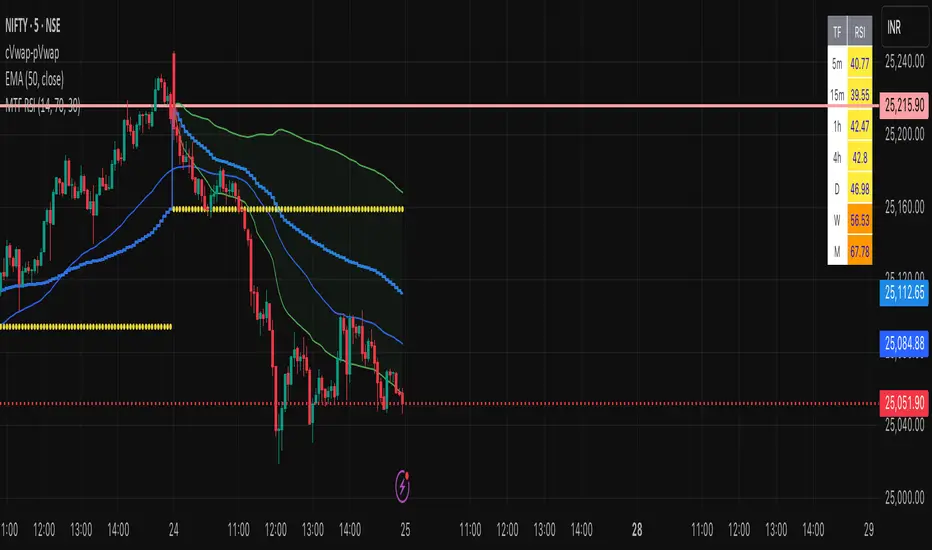
# Multi-Timeframe RSI Table
## Overview
This indicator displays RSI (Relative Strength Index) values across multiple timeframes in a convenient table format, allowing traders to quickly assess momentum conditions across different time horizons without switching charts.
## Features
• *7 Timeframes*: 5m, 15m, 1h, 4h, Daily, Weekly, Monthly
• *Color-coded RSI Values*:
- 🔴 Red: Overbought (≥70)
- 🟢 Green: Oversold (≤30)
- 🟠 Orange: Bullish momentum (50-70)
- 🟡 Yellow: Bearish momentum (30-50)
• *Clean Table Display*: Positioned in top-right corner for easy viewing
• *Customizable Settings*: Adjustable RSI length and overbought/oversold levels
## How to Use
1. Add the indicator to your chart
2. The table automatically displays current RSI values for all timeframes
3. Use color coding to quickly identify:
- *Buying opportunities* when multiple timeframes show green (oversold)
- *Selling opportunities* when multiple timeframes show red (overbought)
- *Trend alignment* when higher timeframes match your trading direction
## Trading Applications
• *Multi-timeframe analysis*: Confirm signals across different time horizons
• *Entry timing*: Find optimal entry points when shorter timeframes align with longer trends
• *Risk management*: Avoid trades when higher timeframes show opposite momentum
• *Swing trading*: Identify when daily/weekly RSI supports your position direction
## Settings
• *RSI Length*: Default 14 periods (standard RSI calculation)
• *Overbought Level*: Default 70 (customizable)
• *Oversold Level*: Default 30 (customizable)
## Best Practices
• Look for alignment across multiple timeframes for stronger signals
• Use higher timeframe RSI to determine overall trend direction
• Combine with price action and support/resistance levels
• Avoid trading against strong momentum shown in higher timeframes
Perfect for day traders, swing traders, and anyone who needs quick multi-timeframe RSI analysis without constantly switching chart timeframes.
Open-source script
In true TradingView spirit, the creator of this script has made it open-source, so that traders can review and verify its functionality. Kudos to the author! While you can use it for free, remember that republishing the code is subject to our House Rules.
Disclaimer
The information and publications are not meant to be, and do not constitute, financial, investment, trading, or other types of advice or recommendations supplied or endorsed by TradingView. Read more in the Terms of Use.