OPEN-SOURCE SCRIPT
VIX Implied Moves
Key Features:
Three Timeframe Bands:
Calculation Methodology:
Visual Features:
Example Calculation (VIX=20, ES=5000):
This indicator helps visualize expected price ranges based on current volatility conditions, with wider bands indicating higher market uncertainty. The probabilistic ranges represent 68% confidence levels (1 standard deviation) derived from options pricing.
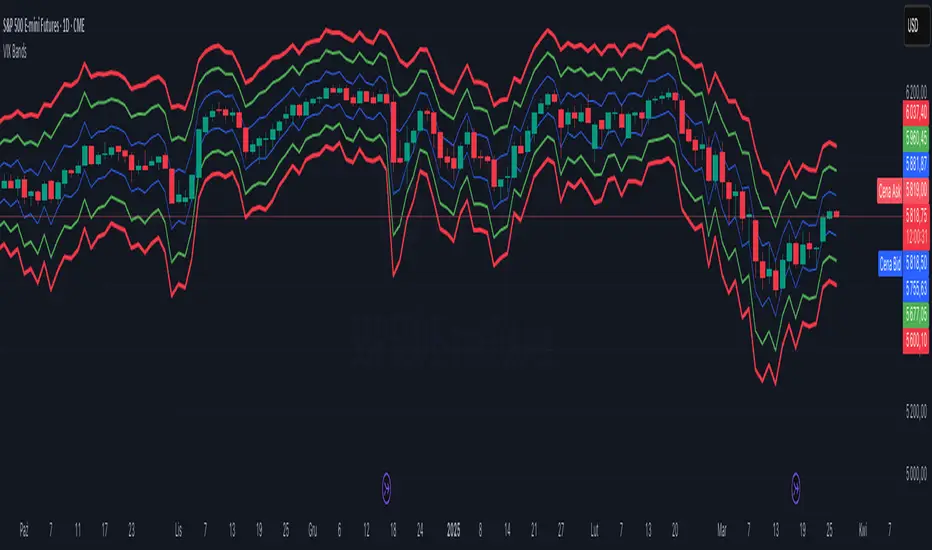
Three Timeframe Bands:
- Daily: Blue bands showing ±1σ expected move
- Weekly: Green bands showing ±1σ expected move
- 30-Day: Red bands showing ±1σ expected move
Calculation Methodology:
- Uses VIX's annualized volatility converted to specific timeframes using square root of time rule
- Trading day convention (252 days/year)
- Band width = Price × (VIX/100) ÷ √(number of periods)
Visual Features:
- Colored semi-transparent backgrounds between bands
- Progressive line thickness (thinner for shorter timeframes)
- Real-time updates as VIX and ES prices change
Example Calculation (VIX=20, ES=5000):
- Daily move = 5000 × (20/100)/√252 ≈ ±63 points
- Weekly move = 5000 × (20/100)/√50 ≈ ±141 points
- Monthly move = 5000 × (20/100)/√21 ≈ ±218 points
This indicator helps visualize expected price ranges based on current volatility conditions, with wider bands indicating higher market uncertainty. The probabilistic ranges represent 68% confidence levels (1 standard deviation) derived from options pricing.
Open-source script
In true TradingView spirit, the creator of this script has made it open-source, so that traders can review and verify its functionality. Kudos to the author! While you can use it for free, remember that republishing the code is subject to our House Rules.
Disclaimer
The information and publications are not meant to be, and do not constitute, financial, investment, trading, or other types of advice or recommendations supplied or endorsed by TradingView. Read more in the Terms of Use.