OPEN-SOURCE SCRIPT
Updated Multi-Timeframe Support & Resistance - KSK
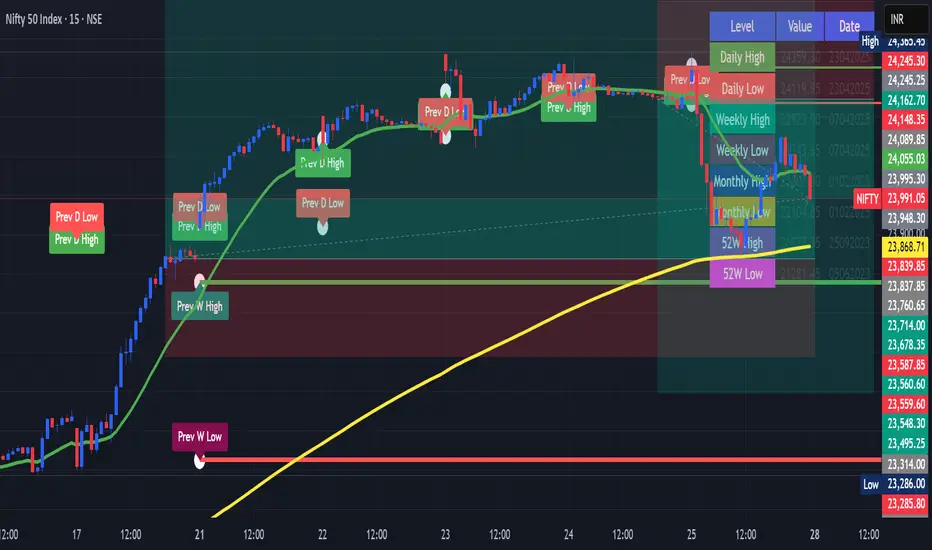
Clean Multi-Timeframe Support & Resistance (S&R) Tool
This indicator automatically plots previous period Highs and Lows for:
🟢 Daily
🔵 Weekly
🟣 Monthly
It provides a clean visual reference for key market levels, which can act as areas of:
Support & Resistance
Breakout or Rejection zones
Entry/Exit decision points
Table Summary:
Compact 2-column table showing all major levels
Can be positioned manually (Top Left, Top Right, etc.)
Auto-refreshes every few bars for performance
Release Notes
Clean Multi-Timeframe Support & Resistance (S&R) ToolThis indicator automatically plots previous period Highs and Lows for:
🟢 Daily
🔵 Weekly
🟣 Monthly
It provides a clean visual reference for key market levels, which can act as areas of:
Support & Resistance
Breakout or Rejection zones
Entry/Exit decision points
Table Summary:
Compact 2-column table showing all major levels
Can be positioned manually (Top Left, Top Right, etc.)
Auto-refreshes every few bars for performance
Open-source script
In true TradingView spirit, the creator of this script has made it open-source, so that traders can review and verify its functionality. Kudos to the author! While you can use it for free, remember that republishing the code is subject to our House Rules.
Disclaimer
The information and publications are not meant to be, and do not constitute, financial, investment, trading, or other types of advice or recommendations supplied or endorsed by TradingView. Read more in the Terms of Use.