OPEN-SOURCE SCRIPT
SMA 20/50 Crossover Strategy - Peter Gangmei
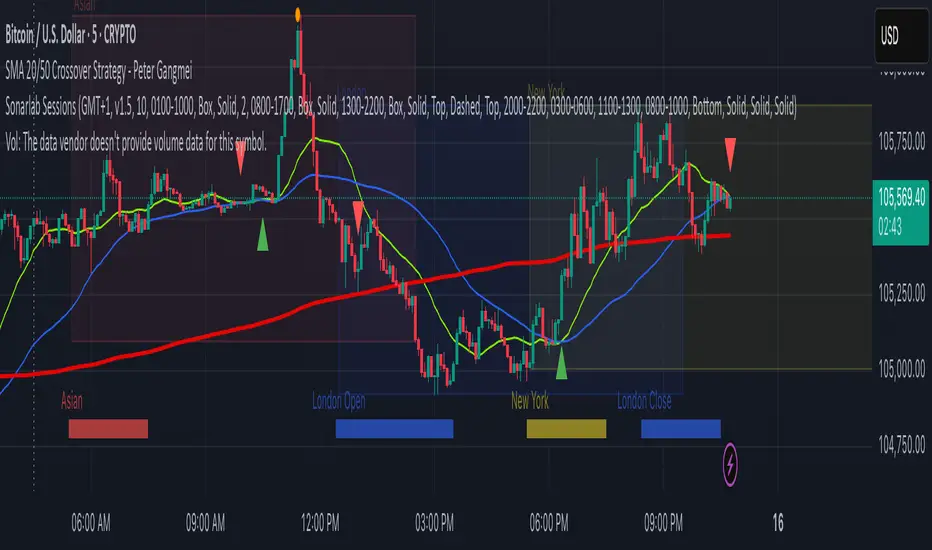
SMA 20/50 Crossover Strategy – Peter Gangmei
This indicator visualizes a classic moving average crossover strategy using Simple Moving Averages (SMA). It plots the 20, 50, and 200 period SMAs and generates clear Buy and Sell signals based on the crossover between the 20 and 50 SMAs:
✅ Buy Signal: When the 20 SMA crosses above the 50 SMA
🔻 Sell Signal: When the 20 SMA crosses below the 50 SMA
📈 The 200 SMA is also plotted for long-term trend context.
Visual cues are displayed on the chart using up/down triangles to indicate entry opportunities. The script also includes built-in alerts so you never miss a trading signal.
Ideal for traders who want a simple, visually intuitive way to follow trend shifts and momentum.
Open-source script
In true TradingView spirit, the creator of this script has made it open-source, so that traders can review and verify its functionality. Kudos to the author! While you can use it for free, remember that republishing the code is subject to our House Rules.
Disclaimer
The information and publications are not meant to be, and do not constitute, financial, investment, trading, or other types of advice or recommendations supplied or endorsed by TradingView. Read more in the Terms of Use.