OPEN-SOURCE SCRIPT
DTA Seven-Candle Trend Indicator
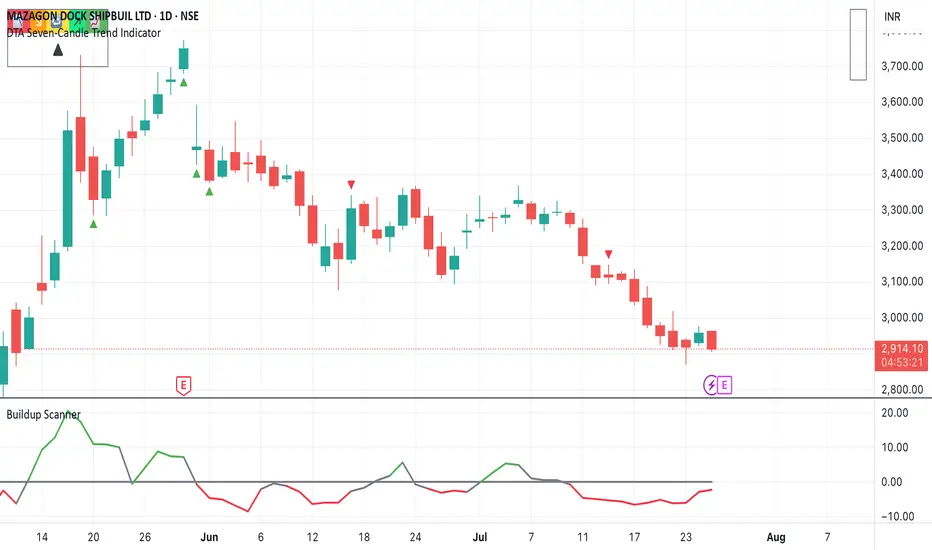
Seven candles Trend Identifier
📊 Output:
* Trend shown in table: "Uptrend", "Downtrend", or "Sideways"
* Strength level:
* "Strong" = 10+ confirmations (HH/HL or LL/LH)
* "Moderate" = 6–9 confirmations
* "Weak" = anything else (Sideways)
* All colors sync with background and label styles
The yellow background color in the script indicates a sideways trend — meaning:
🟨 Yellow Background = Sideways Market
This occurs when:
* The last 7 candles do not form a clear uptrend (higher highs & higher lows)
* And also do not form a clear downtrend (lower highs & lower lows)
🔍 Why It Happens:
* Mixed candle structure
* Price is oscillating in a range
* No dominant directional momentum
* Often seen before breakouts or during consolidation
✅ Example:
Imagine the last 7 candles had highs and lows like this:
Bar High Low
1 100 95
2 98 94
3 101 96
4 100 95
5 99 93
6 102 97
7 100 95
In this case:
* Not consistently making higher highs/lows (so not uptrend)
* Not consistently making lower highs/lows (so not downtrend)
➡️ Therefore, the script marks it as sideways, and the background turns yellow.
Open-source script
In true TradingView spirit, the creator of this script has made it open-source, so that traders can review and verify its functionality. Kudos to the author! While you can use it for free, remember that republishing the code is subject to our House Rules.
Disclaimer
The information and publications are not meant to be, and do not constitute, financial, investment, trading, or other types of advice or recommendations supplied or endorsed by TradingView. Read more in the Terms of Use.