OPEN-SOURCE SCRIPT
Updated Day75Range
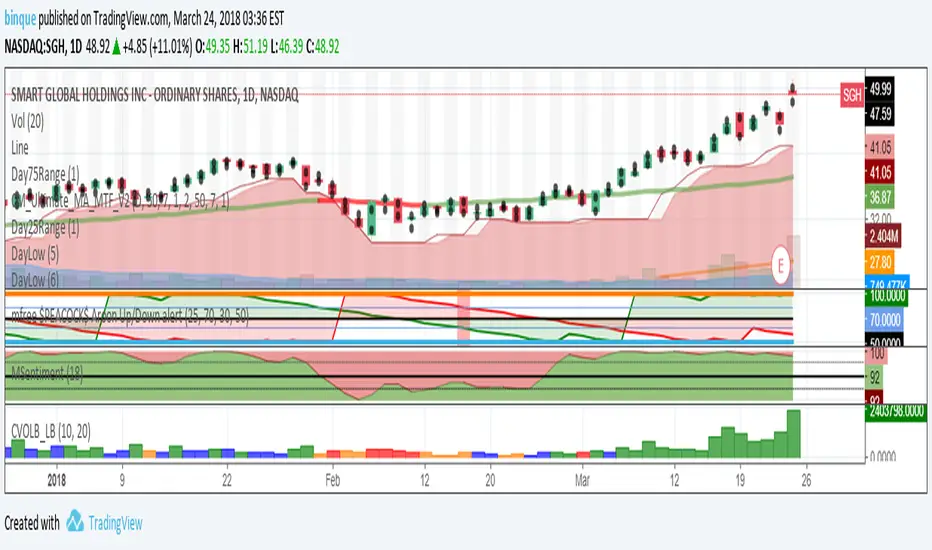
Day75Range(1) use to plot the 75% range of a trading day. I use a CIRCLE or DOT to indict the 75% range of the trading day.
Release Notes
Day75Range(1) - Plot on the candle the 75% upper range of the daily price. This helps to show when the current price is at or above the 75% price range of the day. Best when used with other indicators to show early building strength in price. On the attached chart, if you look at Feb 23, 2018 you will see a green candle that closed above the 75% market of the trading day. For that day the 75% mark was at 31.00 and the close of the day was at 33.20 That indicators a potential start of a strong swing trade up. As you can see on the DayLow(5) and DayLow(6) indicators the candle is above the daily low and continues to stay above the weekly daily low for the next several weeks. If the price closes below the 25% daily range as shown on the Day25Range(1) indicator, this could indicate a possible start of weakening in the price movement.Open-source script
In true TradingView spirit, the creator of this script has made it open-source, so that traders can review and verify its functionality. Kudos to the author! While you can use it for free, remember that republishing the code is subject to our House Rules.
Disclaimer
The information and publications are not meant to be, and do not constitute, financial, investment, trading, or other types of advice or recommendations supplied or endorsed by TradingView. Read more in the Terms of Use.
Open-source script
In true TradingView spirit, the creator of this script has made it open-source, so that traders can review and verify its functionality. Kudos to the author! While you can use it for free, remember that republishing the code is subject to our House Rules.
Disclaimer
The information and publications are not meant to be, and do not constitute, financial, investment, trading, or other types of advice or recommendations supplied or endorsed by TradingView. Read more in the Terms of Use.