OPEN-SOURCE SCRIPT
Updated The Normalizer [BVCC]
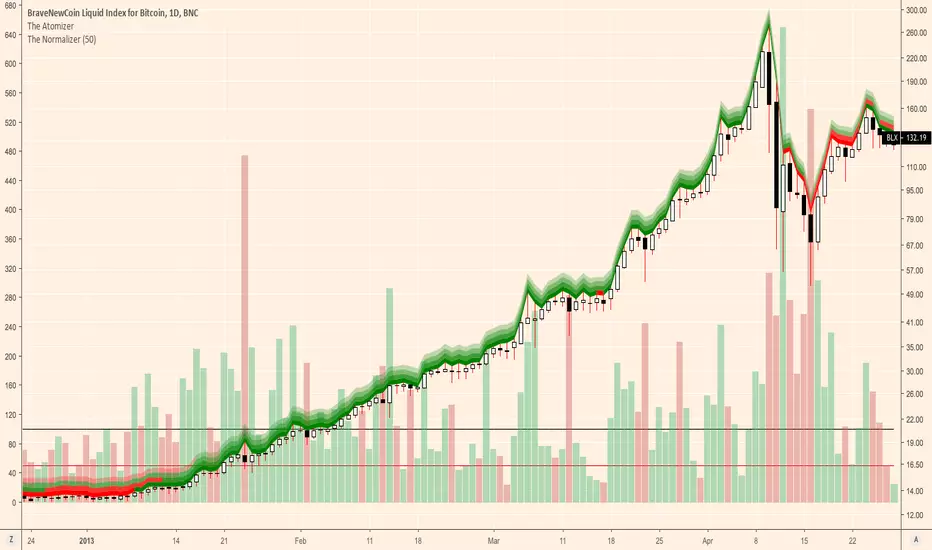
The Normalizer adds an indicator to your chart with the option to view regular Volume, normalized Volume or normalized price.
Normalized Volume divides the current Volume bar into a moving average and multiplies by 100. The resulting plot is a histogram showing how far above or below the moving average that volume bar was.
Normalized Price does the exact same thing, but uses the close price of the current candle.
The result of a normalized bar chart is that sometimes activities of unusually low or high patterns can be seen that are not obvious when looking at the standard data points.
Customizable Settings include;
1) Check/Uncheck the first box to set the view to Volume or Price
2) Check 'Normalize' when on Volume to toggle between standard Volume and Normalized Volume
3) Price is always Normalized
4) Normalization is calculated from the SMA and the default is set to 9 - John Bollinger suggest setting this to 50
5) Normalization period can be set with the 'Period' option
This indicator was created for members of the BVCC trading community as an example of the normalization methods described in John Bollinger's "Bollinger on Bollinger Bands". Mr. Bollinger talks extensively about normalization and specifically volume normalization. I added the price normalization as a fun bonus just because. :)
Release Notes
I fixed the Volume bar colors so that green goes with bullish candles and red goes with bearish. I had it reversed. Also, updated screenshot to reflect the utility of the indicator. Black line is a 100% reference.
Red Line is a 50% reference.
Release Notes
Changed the default normalization factor to 50 (as suggested by J. Bollinger)Open-source script
In true TradingView spirit, the creator of this script has made it open-source, so that traders can review and verify its functionality. Kudos to the author! While you can use it for free, remember that republishing the code is subject to our House Rules.
Disclaimer
The information and publications are not meant to be, and do not constitute, financial, investment, trading, or other types of advice or recommendations supplied or endorsed by TradingView. Read more in the Terms of Use.
Open-source script
In true TradingView spirit, the creator of this script has made it open-source, so that traders can review and verify its functionality. Kudos to the author! While you can use it for free, remember that republishing the code is subject to our House Rules.
Disclaimer
The information and publications are not meant to be, and do not constitute, financial, investment, trading, or other types of advice or recommendations supplied or endorsed by TradingView. Read more in the Terms of Use.