OPEN-SOURCE SCRIPT
Updated B A N K $ - Advanced Session Ranges
This is a simple indicator that has been designed to aid intraday trading and has a few components;
Key Features
Session Ranges + Optimal Exit Time
Information ℹ️
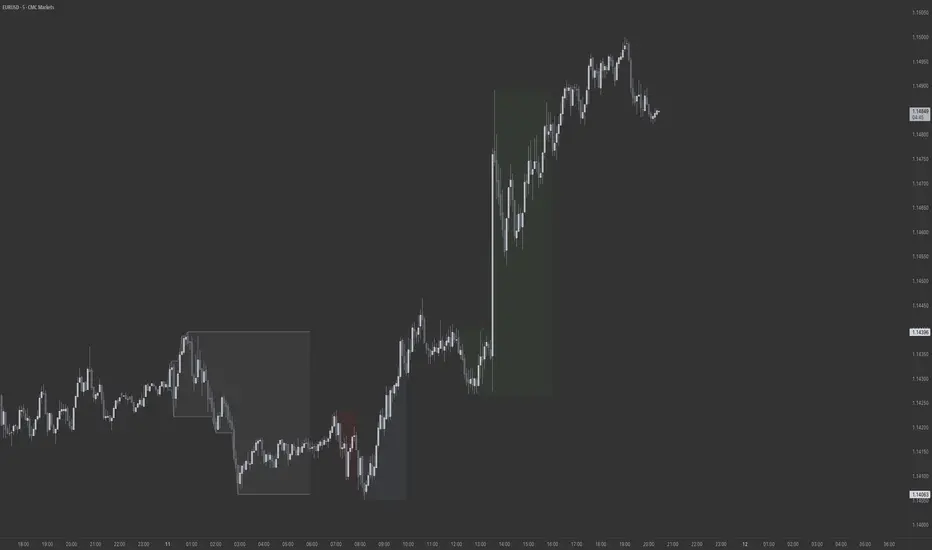
This is a visual depiction of the 3 main sessions in the markets. Asia, London & New York. The default timings are set to perfectly align with each session however the Start & End times for each session can be changed in the settings. (I've added a website on the tooltip to easily convert timezones)
I have also added a 4th session range called "Optimal Exit Time". This is statistically the most probable time window for the opposite High / Low of Day to form is within this window. It helps the trader understand when they should look to take profit.
How It Works 🔑
The indicator automatically maps on two lines for the High & Low of the range between the selected Start & End time, it also colours the background.
The individual lines & background can be toggled & customised to the traders preference.
Asia Pip Range
Information ℹ️
This displays the Asia Range in pips beneath the Asia Session Low.
How It Works 🔑
This calculates the distance between the Asia High - Asia Low in pips. It will automatically recalibrate to the timings the trader sets in the settings if they change the Start / End.
New York Midnight Open Line
Information ℹ️
This helps look for Buys beneath the line for a Bullish Expansion day 📈 & Sells above the line for a Bearish Expansion day 📉
How It Works 🔑
This adds a horizontal line to the chart that is anchored to New York Midnight Open (00:00) by default. It can be changed in the settings in required. You can also toggle on the time being shown above the line.
Key Features
- Session Ranges + Optimal Exit Time
- Asia Pip Range
- New York Midnight Open Line
Session Ranges + Optimal Exit Time
Information ℹ️
This is a visual depiction of the 3 main sessions in the markets. Asia, London & New York. The default timings are set to perfectly align with each session however the Start & End times for each session can be changed in the settings. (I've added a website on the tooltip to easily convert timezones)
I have also added a 4th session range called "Optimal Exit Time". This is statistically the most probable time window for the opposite High / Low of Day to form is within this window. It helps the trader understand when they should look to take profit.
How It Works 🔑
The indicator automatically maps on two lines for the High & Low of the range between the selected Start & End time, it also colours the background.
The individual lines & background can be toggled & customised to the traders preference.
Asia Pip Range
Information ℹ️
This displays the Asia Range in pips beneath the Asia Session Low.
How It Works 🔑
This calculates the distance between the Asia High - Asia Low in pips. It will automatically recalibrate to the timings the trader sets in the settings if they change the Start / End.
New York Midnight Open Line
Information ℹ️
This helps look for Buys beneath the line for a Bullish Expansion day 📈 & Sells above the line for a Bearish Expansion day 📉
How It Works 🔑
This adds a horizontal line to the chart that is anchored to New York Midnight Open (00:00) by default. It can be changed in the settings in required. You can also toggle on the time being shown above the line.
Release Notes
The original code was showing the NYMO line on higher timeframes when it shouldn't be visible on anything over the 1h.➕ I've now added a new line of code;
isAllowedTimeframe = timeframe.isintraday and timeframe.multiplier <= 60
if (iMDisplay and isAllowedTimeframe)
This means that now the New York Midnight Open line is now only visible up to and including the 60 minute timeframe.
Release Notes
The ASR text sometimes looked messy when viewing on the 1h chart because the text was overlapping with candles. I have added a toggle option that allows you to choose between showing the Asia Pip Range on the 1h chart or not. The default setting is to disable this to keep the charts clean."false" can be changed to "true" to have the setting enabled by default.
showOn60Min = input(false, "Asia Pip Range Visible on 1h", group="Sessions")
Release Notes
New Features- Added Standard Deviation Levels (STDV) to the Asia Range
- Extended the London Session time by 1 hour by default
- Adjusted the New York Midnight Open default colour
Standard Deviation Levels
This adds horizontal lines above & below the Asia Session Range. This can aid the trader to visualise where the High / Low of day is likely to form within the current trading day.
I have added 3 STDV levels (each can be toggled) and there is also a master toggle to show/hide all of them;
showSTDVLevels = input(true, "Show STDV Levels", group="Sessions")
The indicator calculates the current Asia Pip Range (High to Low of the ASR). The first STDV is equal to the Asia Pip Range. STDV 2 is equal to 2x of the the Asia Pip Range. STDV 3 is equal to 3x of the the Asia Pip Range.
Release Notes
Changelog- Removed 2nd & 3rd STDV (tidy up the settings)
- Removed Optimal Exit Time Session
+ Added Frankfurt Open Session
+ Updated Session Timings (more accurate killzones)
+ Updated Session Colours
Recommended Settings
- Disable ‘Labels on price scale’
- Disable Frankfurt Session
- Disable High & Low Lines for Frankfurt, London & New York but keep for Asia
Explanation
Frankfurt open is where the Eurozone volume comes into the market. This is typically the hour that manipulates Highs/Lows. I personally wait for London open before trading however I have added Frankfurt to the indicator in order to have the option to visually depict it on the chart.
I have removed the Optimal Exit Time because although useful, it was unnecessary clutter in the indicator.
Open-source script
In true TradingView spirit, the creator of this script has made it open-source, so that traders can review and verify its functionality. Kudos to the author! While you can use it for free, remember that republishing the code is subject to our House Rules.
Disclaimer
The information and publications are not meant to be, and do not constitute, financial, investment, trading, or other types of advice or recommendations supplied or endorsed by TradingView. Read more in the Terms of Use.