OPEN-SOURCE SCRIPT
Updated Pre-Market High & Low
Indicator: Pre-Market High & Low
This indicator tracks the high and low price levels of a stock during the pre-market session (4:00 AM - 9:30 AM EST), before the official market open. It dynamically updates during pre-market hours, identifying the highest and lowest prices reached. Once the pre-market session ends, these levels are saved and plotted on the chart as reference points for the regular market session.
Key Features:
Dynamic Updates: Continuously tracks the high and low during pre-market hours.
Visual Indicators: Plots horizontal lines representing the pre-market high (green) and low (red).
Post-Market Reference: Once pre-market ends, these levels remain visible for the regular market session as reference points for potential breakout or breakdown levels.
How to Use:
Use this indicator to identify potential breakout or breakdown levels that may happen at the market open.
The green line represents the highest price reached during pre-market, while the red line indicates the lowest price.
The indicator will stop updating once the pre-market session closes (9:30 AM EST) and will remain visible as reference levels throughout the trading day.
Ideal for:
Day traders looking for pre-market support and resistance levels.
Traders analyzing the initial market reaction based on pre-market price action.
Release Notes
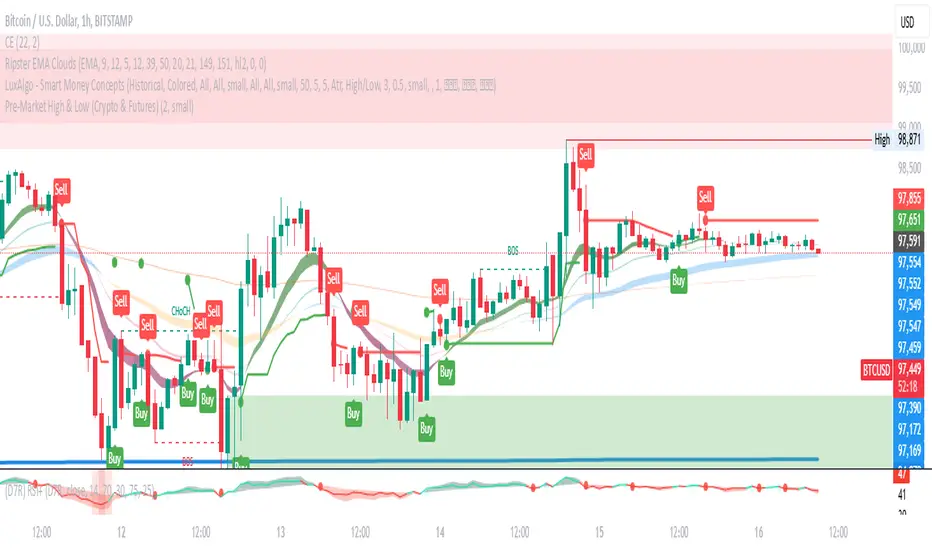
Title: Pre-Market High & Low Indicator (Crypto & Futures)Description:
This indicator tracks the pre-market high and low for assets including cryptocurrencies and futures (e.g., ES1!, NQ1!). It monitors price movements from 00:00 ET to 09:30 ET, marking the high and low levels for the session.
Pre-market range: Displayed after 09:30 ET.
Color-coded levels:
Green if the pre-market high is above the previous day's high.
Red if the pre-market low is below the previous day's low.
Blue otherwise.
Customizable settings: Adjust line thickness and label font size.
Dynamic updates: Levels refresh automatically based on the pre-market session.
Ideal for traders analyzing market trends before the official trading session begins. 🚀
Open-source script
In true TradingView spirit, the creator of this script has made it open-source, so that traders can review and verify its functionality. Kudos to the author! While you can use it for free, remember that republishing the code is subject to our House Rules.
Disclaimer
The information and publications are not meant to be, and do not constitute, financial, investment, trading, or other types of advice or recommendations supplied or endorsed by TradingView. Read more in the Terms of Use.