OPEN-SOURCE SCRIPT
3 EMA/SMA + Colored Candles[C2Trends]
// Indicator Features:
// 1) 3 Exponential Moving Averages and 3 Simple Moving Averages.
// 2) Additional EMA input for colored candles(EMA is hidden from chart, input used for coloring of candles only)
// 3) Turn colored candles on/off from main input tab of indicator settings.
// 4) Turn SMA's and EMA's on/off from main input tab of indicator settings.
// 5) Select single color or 2 color EMA and SMA lines from main input tab of indicator settings.
// Indicator Notes:
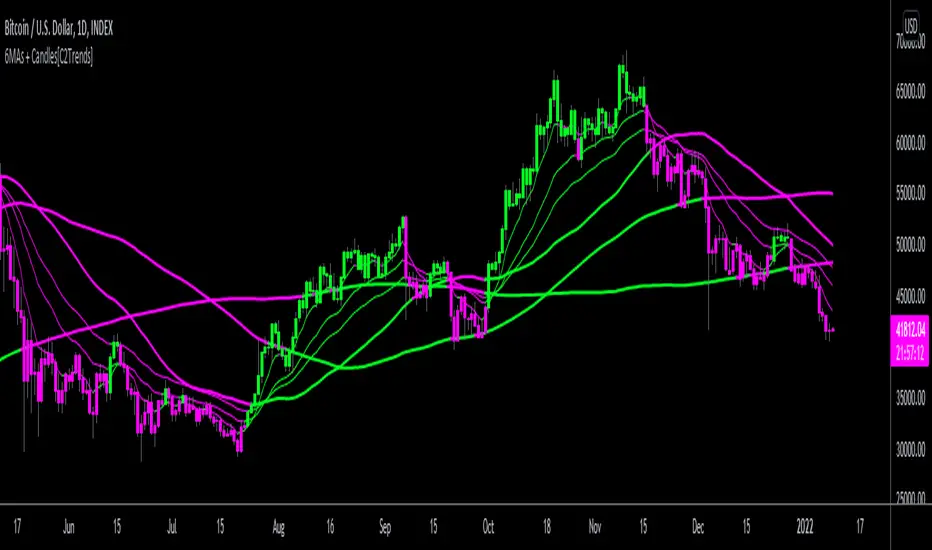
// 1) 'Candle EMA' input is the trend lookback period for the price candle colors. When price is above desired Candle EMA, price candles will color green. When price is below the Candle EMA, price candles will color fuchsia.
// 2) If you are using another indicator that colors the price candles it may overlap the candle colors applied by this indicator. Trying hiding or removing other indicators to troubleshoot if having candle color issues.
// 3) Using 2-color price moving averages: when price is above an average the average will color green, when price is below an average the average will color fuchsia.
// 1) 3 Exponential Moving Averages and 3 Simple Moving Averages.
// 2) Additional EMA input for colored candles(EMA is hidden from chart, input used for coloring of candles only)
// 3) Turn colored candles on/off from main input tab of indicator settings.
// 4) Turn SMA's and EMA's on/off from main input tab of indicator settings.
// 5) Select single color or 2 color EMA and SMA lines from main input tab of indicator settings.
// Indicator Notes:
// 1) 'Candle EMA' input is the trend lookback period for the price candle colors. When price is above desired Candle EMA, price candles will color green. When price is below the Candle EMA, price candles will color fuchsia.
// 2) If you are using another indicator that colors the price candles it may overlap the candle colors applied by this indicator. Trying hiding or removing other indicators to troubleshoot if having candle color issues.
// 3) Using 2-color price moving averages: when price is above an average the average will color green, when price is below an average the average will color fuchsia.
Open-source script
In true TradingView spirit, the creator of this script has made it open-source, so that traders can review and verify its functionality. Kudos to the author! While you can use it for free, remember that republishing the code is subject to our House Rules.
Disclaimer
The information and publications are not meant to be, and do not constitute, financial, investment, trading, or other types of advice or recommendations supplied or endorsed by TradingView. Read more in the Terms of Use.