OPEN-SOURCE SCRIPT
Updated ICT Premium/Discount
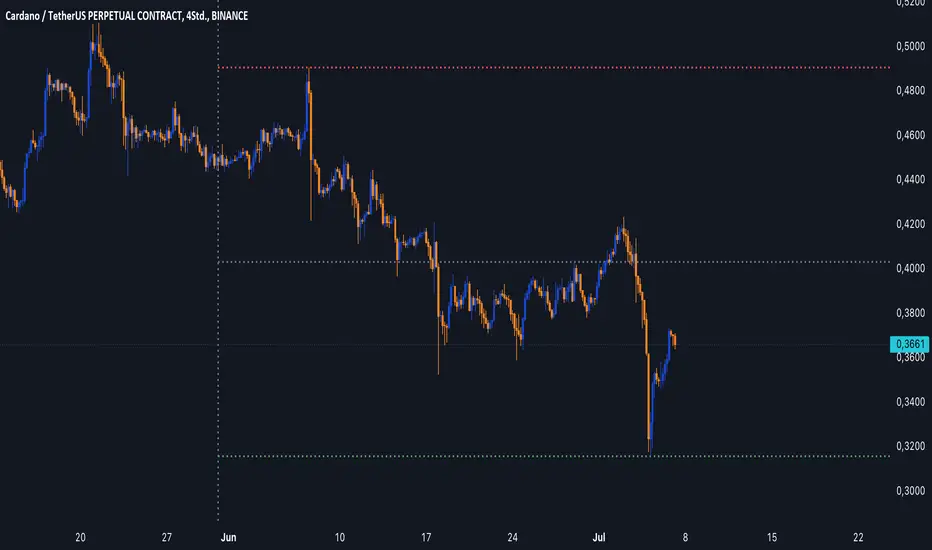
This script indicator prints lines for the highest, lowest and middle price in a selected time period (in days).
With that you can easily see wheter the price is currently high, low or balanced compared to the prices in the selected time period.
I also added a gray dotted vertical line to the chart which represents the beginning of your selected time period
You can choose the time period on your own and you can also customize the color and style of the lines.
Your lines may get printed in a separate window. To fix this, click on the indicator and select
Move to -> existing pane above
Your lines also may stay stuck on the same place on the chart and are not fixed to a high/low. To fix this, right-click on the left price scale and select
Merge all scales into one -> on the right
Release Notes
This script indicator prints lines for the highest, lowest and middle price in a selected time period (in days).With that you can easily see wheter the price is currently high, low or balanced compared to the prices in the selected time period.
I also added a gray dotted vertical line to the chart which represents the beginning of your selected time period
You can choose the time period on your own and you can also customize the color and style of the lines.
Your lines may get printed in a separate window. To fix this, click on the indicator and select
Move to -> existing pane above
Your lines also may stay stuck on the same place on the chart and are not fixed to a high/low. To fix this, right-click on the left price scale and select
Merge all scales into one -> on the right
Release Notes
The indicator now does not calculate the high/low/middle of the last X days as selected in the input anymore.It now calculates the high/low/middle since the start of the previous month.
For example: Today is July 7th. Then the indicator calculates the high/low/middle beginning from June 1st.
So now you don't have to adapt the date daily just to calculate the PML (Previous Month Low) and PMH (Previous Month High).
Open-source script
In true TradingView spirit, the creator of this script has made it open-source, so that traders can review and verify its functionality. Kudos to the author! While you can use it for free, remember that republishing the code is subject to our House Rules.
Disclaimer
The information and publications are not meant to be, and do not constitute, financial, investment, trading, or other types of advice or recommendations supplied or endorsed by TradingView. Read more in the Terms of Use.