OPEN-SOURCE SCRIPT
Updated Momentum (80) + ATR (14)
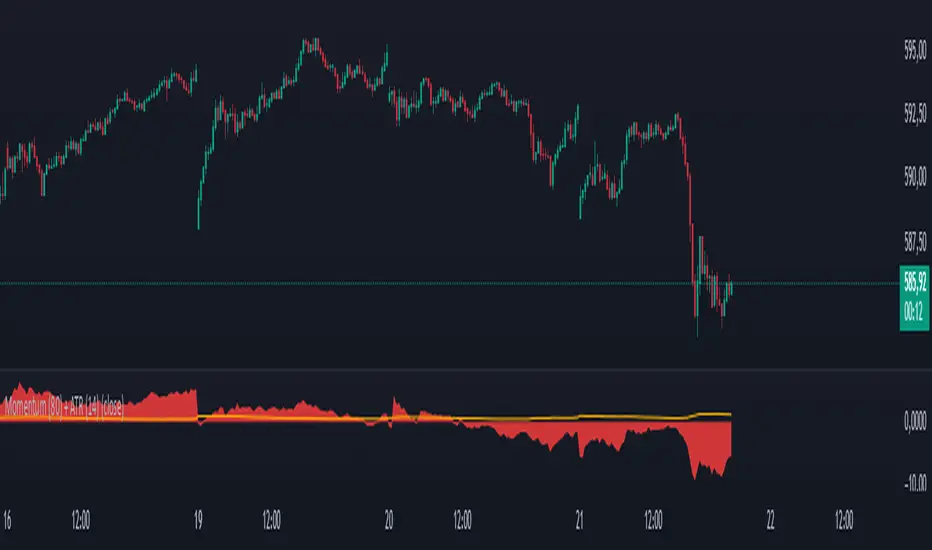
his indicator combines two essential technical analysis tools in a single panel for enhanced market insight:
🔹 Momentum (80 periods): Measures the difference between the current price and the price 80 bars ago. Displayed as a semi-transparent filled area, it helps to visually identify shifts in price momentum over a longer timeframe.
🔸 ATR (Average True Range, 14 periods): Shown as a fine orange line, the ATR represents average market volatility over 14 periods, highlighting phases of calm or increased price fluctuations.
By viewing both momentum and volatility simultaneously, traders can better assess trend strength and market conditions, improving decision-making across assets such as stocks, forex, and cryptocurrencies.
✅ Suitable for all asset types
✅ Complements other indicators like RSI, MACD, and Bollinger Bands
✅ Categorized under Momentum & Volatility indicators
Release Notes
📈 Momentum (80) + ATR (14) IndicatorThis custom indicator combines two essential technical tools—Momentum and Average True Range (ATR)—to help traders better interpret both market directional strength and volatility conditions in a single view.
🔹 Momentum (80)
The momentum component calculates the difference between the current closing price and the closing price 80 periods ago:
Momentum = Close - Close[80].
This long lookback period helps to smooth out noise and highlight sustained movements in price. The result is plotted as a filled area, visually emphasizing strong upward or downward momentum. It’s especially useful for identifying emerging trends or the weakening of existing ones.
🔹 ATR (14)
The Average True Range (ATR), using a standard 14-period setting, is plotted as a single line. It provides a real-time measure of market volatility by calculating the average range between high and low prices, adjusted for gaps.
A dynamic label shows the current ATR value on the latest bar, helping traders quickly assess whether volatility is increasing or contracting—key for position sizing and risk management.
Open-source script
In true TradingView spirit, the creator of this script has made it open-source, so that traders can review and verify its functionality. Kudos to the author! While you can use it for free, remember that republishing the code is subject to our House Rules.
Disclaimer
The information and publications are not meant to be, and do not constitute, financial, investment, trading, or other types of advice or recommendations supplied or endorsed by TradingView. Read more in the Terms of Use.