OPEN-SOURCE SCRIPT
Updated Grid Bot Visualizer V1
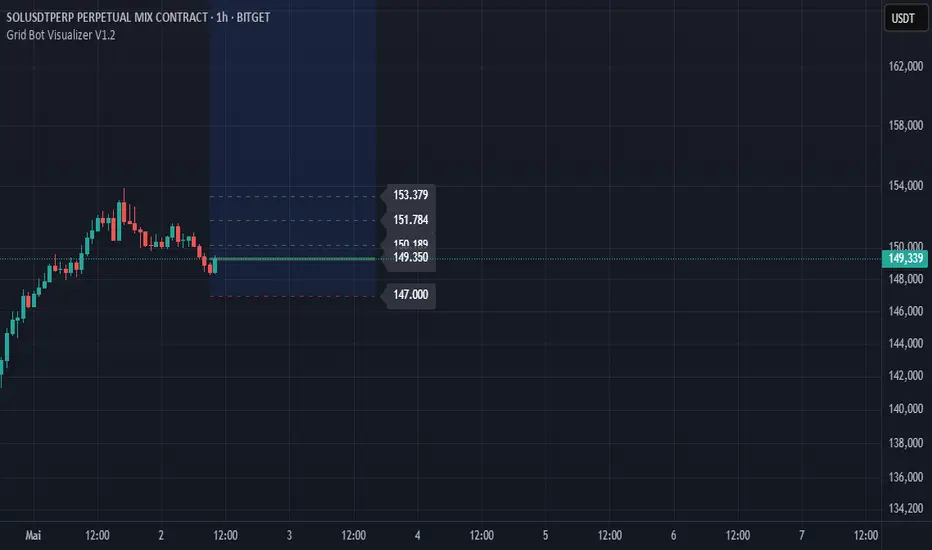
📊 Grid Bot Visualizer – V1
A dynamic and visual support tool for grid trading strategies.
🔧 Key Features
• Fixed grid levels based on a central entry price
• Customizable spacing, number of levels, and range
• Color-coded lines (🟢 green above, 🔴 red below)
• Expands automatically when price exceeds boundaries (within the defined box)
• Optional price labels shown outside the grid
• Grid visually framed by a blue box
• Vertical line to mark grid origin
• Built-in alert when price hits a grid level
⚙️ Use Case
Ideal for visualizing grid bot logic in volatile markets.
Monitor how price interacts with predefined zones.
✅ Alert Ready
Use alertcondition to get notified when a grid level is touched.
Release Notes
📊 Grid Bot Visualizer – V1.1
A dynamic and visual support tool for grid trading strategies.
🔧 Key Features
• Fixed grid levels based on a central entry price
• Customizable spacing, number of levels, and range
• Color-coded lines (🟢 green above, 🔴 red below)
• Expands automatically when price exceeds boundaries (within the defined box)
• Optional price labels shown outside the grid
• Grid visually framed by a blue box
• Vertical line to mark grid origin
• Built-in alert when price hits a grid level
⚙️ Use Case
Ideal for visualizing grid bot logic in volatile markets.
Monitor how price interacts with predefined zones.
✅ Alert Ready
Use alertcondition to get notified when a grid level is touched.
🛠️ Updates in V1.1
• Fixed a few minor bugs
• Updated visual appearance for a more intuitive experience
Release Notes
🛠️ Updates in V1.2• Fixed a few minor bugs
• Bot levels can now be positioned above and below the entry price
Open-source script
In true TradingView spirit, the creator of this script has made it open-source, so that traders can review and verify its functionality. Kudos to the author! While you can use it for free, remember that republishing the code is subject to our House Rules.
Disclaimer
The information and publications are not meant to be, and do not constitute, financial, investment, trading, or other types of advice or recommendations supplied or endorsed by TradingView. Read more in the Terms of Use.