PROTECTED SOURCE SCRIPT
Xypher Heatmap RSI / STOCH
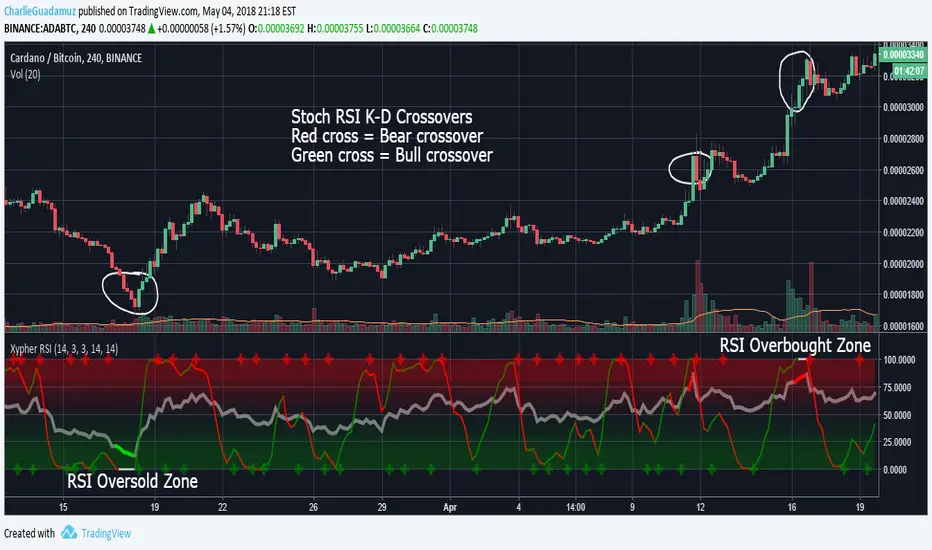
Combines classic RSI and StochRSI in one script, with heatmaps for oversold and overbought zones. Use it with the black template :)
K and D values from Stoch are merged in one line, changing colors according to the bearish or bullish crossovers between them
Red to green -> Bullish crossover, consider an entry. Its signaled with a green cross
Green to red -> Bearish crossover, consider getting out. Its signaled with a green cross
RSI is plotted with a thick gray line.
Green lines indicate the oversold zone, consider an entry
Red lines indicate the overbought zone, consider an exit
Protected script
This script is published as closed-source. However, you can use it freely and without any limitations – learn more here.
Disclaimer
The information and publications are not meant to be, and do not constitute, financial, investment, trading, or other types of advice or recommendations supplied or endorsed by TradingView. Read more in the Terms of Use.