OPEN-SOURCE SCRIPT
75: Notable Financial Crises
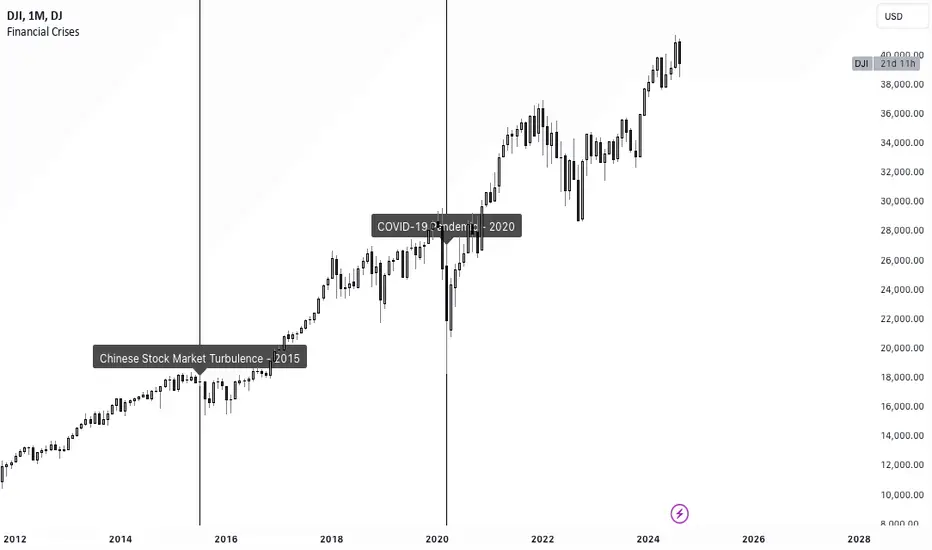
The TradingView script named "75: Notable Financial Crises" visualizes and marks significant financial crises on a financial chart.
This script plots vertical lines on the a chart corresponding to specific dates associated with notable financial crises in history. These crises could include events like the Great Depression (1929), Black Monday (1987), the Dot-com Bubble (2000), the Global Financial Crisis (2008), and others. By marking these dates on a chart, traders and analysts can easily observe the impact of these events on market behavior.
This script plots vertical lines on the a chart corresponding to specific dates associated with notable financial crises in history. These crises could include events like the Great Depression (1929), Black Monday (1987), the Dot-com Bubble (2000), the Global Financial Crisis (2008), and others. By marking these dates on a chart, traders and analysts can easily observe the impact of these events on market behavior.
Open-source script
In true TradingView spirit, the creator of this script has made it open-source, so that traders can review and verify its functionality. Kudos to the author! While you can use it for free, remember that republishing the code is subject to our House Rules.
Disclaimer
The information and publications are not meant to be, and do not constitute, financial, investment, trading, or other types of advice or recommendations supplied or endorsed by TradingView. Read more in the Terms of Use.