OPEN-SOURCE SCRIPT
Updated Artharjan INDIA VIX v/s Nifty Volatility Dashboard
Hi,
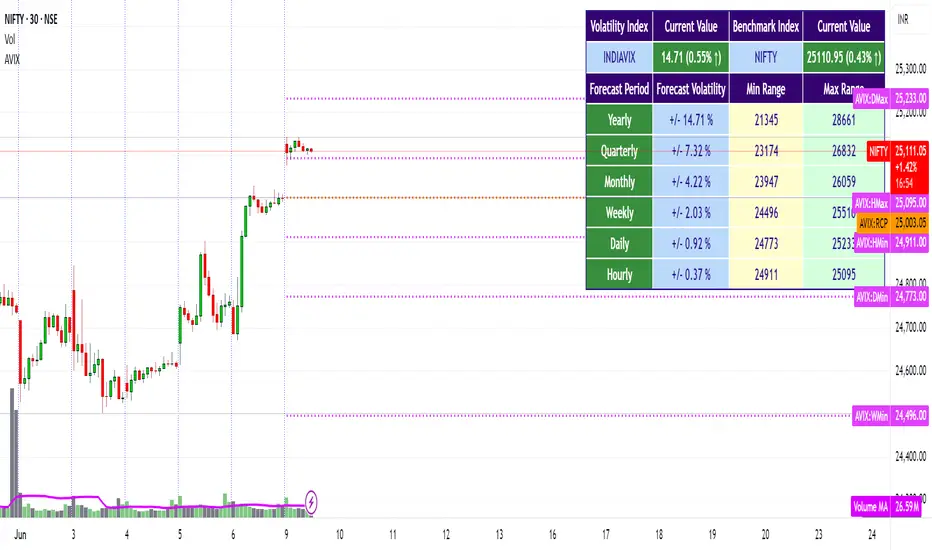
I have created Artharjan INDIA VIX v/s Nifty Volatility Dashboard to forecast the Annual, Quarterly, Monthly, Weekly, Daily and Hourly Volatility of NIFTY Benchmark Index based on current value of INDIA VIX. This will help Index Options Sellers to decide the range of Nifty for the given period based on current level of volatility indicated by INDIA VIX.
Options Sellers may make use of the Min Range and Max Range values for the Strike Price Selection.
Regards
Rahul Desai
Artharjan
Release Notes
Updated VIX and NIFTY Background Color based on previous day values - Green if Today's Value is Greater than Previous Day Value & Red if Today's Value is Less than or equal to Previous Day Value Release Notes
Updated the Yearly Min and Max Range of Nifty returns based on current value of India VixRelease Notes
Hello Traders,I have made significant changes to your favorite indicator "Artharjan INDIA VIX v/s Nifty Volatility Dashboard" and I hope you would enjoy using this new version of the indicator.
Changes made:
1] Now you can plot STATIC volatility levels of NIFTY based on the previous daily closing prices of NIFTY and INDIAVIX or you may chose to plot DYNAMIC volatility levels of NIFTY based on the last traded price of NIFTY and INDIAVIX. This will give traders to flexibility to identify which Short Option Strikes to Roll Over or Roll Under depending upon market movement.
2] I have tried to offer lots of flexibility in terms of Showing and or Plotting various levels on the Chart, on the Price Scale and also in the form of a Dashboard Table. This will allow user of this indicator to get flexibility in terms of showing vital details in the form of lines, prices, tables on the chart there by not cluttering the chart with unwanted details.
3] User may try to Plot the forecasted volatility levels ranging from Hourly to Yearly time horizon.
4] Also tried to show how much % change NIFTY and INDIAVIX have undergone since previous day closing.
Regards
Rrahul Desai
Artharjan
Release Notes
Made some cosmetic changes and rounded off the Levels plotted on the price scale.Release Notes
Added the feature to extend the lines to the Left / Right or on either side of the of the Price Chart.Release Notes
Made a minor bug fix.Open-source script
In true TradingView spirit, the creator of this script has made it open-source, so that traders can review and verify its functionality. Kudos to the author! While you can use it for free, remember that republishing the code is subject to our House Rules.
I am a professional trader and have passion for teaching and programming. In case anyone is interested to know more then feel to drop me a line at rahul30m@gmail.com / +91-9136096161
Disclaimer
The information and publications are not meant to be, and do not constitute, financial, investment, trading, or other types of advice or recommendations supplied or endorsed by TradingView. Read more in the Terms of Use.
Open-source script
In true TradingView spirit, the creator of this script has made it open-source, so that traders can review and verify its functionality. Kudos to the author! While you can use it for free, remember that republishing the code is subject to our House Rules.
I am a professional trader and have passion for teaching and programming. In case anyone is interested to know more then feel to drop me a line at rahul30m@gmail.com / +91-9136096161
Disclaimer
The information and publications are not meant to be, and do not constitute, financial, investment, trading, or other types of advice or recommendations supplied or endorsed by TradingView. Read more in the Terms of Use.