OPEN-SOURCE SCRIPT
Color Change EMA 200 (4H)
200 Color Change EMA (4H Locked)
Overview
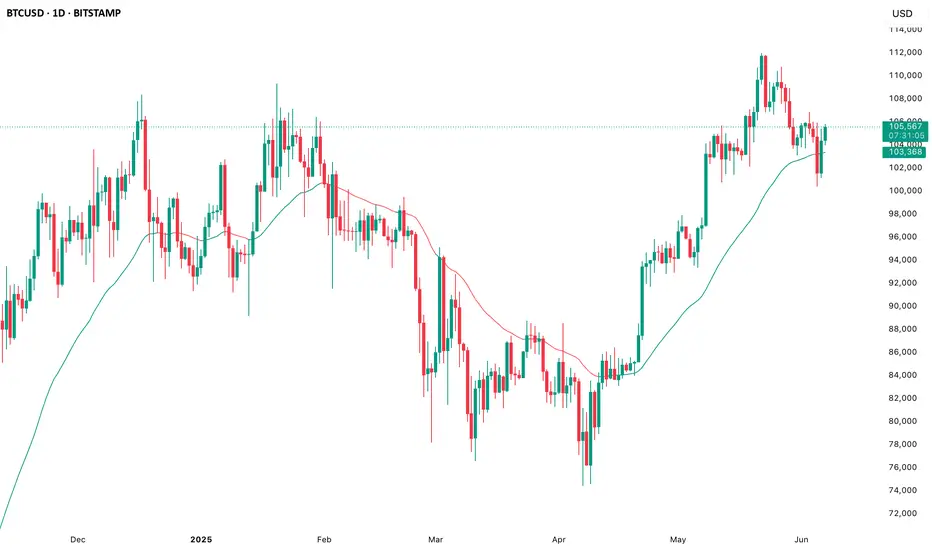
This indicator displays a 200-period Exponential Moving Average (EMA) that is locked to the 4-hour timeframe, regardless of what chart timeframe you're currently viewing. The EMA line changes color dynamically based on price action to provide clear visual trend signals.
Key Features
• Multi-Timeframe Capability: Always shows the 4H 200 EMA on any chart timeframe
• Dynamic Color Coding:
- Green: Price is above the 200 EMA (bullish condition)
- Red: Price is below the 200 EMA (bearish condition)
• Clean Visual Design: Bold 2-pixel line width for clear visibility
• Real-time Updates: Colors change instantly as price crosses above or below the EMA
How to Use
1. Add the indicator to any timeframe chart
2. The 4H 200 EMA will appear as a smooth line
3. Watch for color changes:
- When the line turns green, it indicates price strength above the key moving average
- When the line turns red, it suggests price weakness below the moving average
4. Use for trend identification, support/resistance levels, and entry/exit timing
Best Practices
• Combine with other technical analysis tools for confirmation
• Use the color changes as alerts for potential trend shifts
• Consider the 200 EMA as a major support/resistance level
• Works well for swing trading and position sizing decisions
Settings
• Length: Default 200 periods (customizable)
• Source: Default closing price (customizable)
Perfect for traders who want to keep the important 4H 200 EMA visible across all timeframes with instant visual trend feedback.
Overview
This indicator displays a 200-period Exponential Moving Average (EMA) that is locked to the 4-hour timeframe, regardless of what chart timeframe you're currently viewing. The EMA line changes color dynamically based on price action to provide clear visual trend signals.
Key Features
• Multi-Timeframe Capability: Always shows the 4H 200 EMA on any chart timeframe
• Dynamic Color Coding:
- Green: Price is above the 200 EMA (bullish condition)
- Red: Price is below the 200 EMA (bearish condition)
• Clean Visual Design: Bold 2-pixel line width for clear visibility
• Real-time Updates: Colors change instantly as price crosses above or below the EMA
How to Use
1. Add the indicator to any timeframe chart
2. The 4H 200 EMA will appear as a smooth line
3. Watch for color changes:
- When the line turns green, it indicates price strength above the key moving average
- When the line turns red, it suggests price weakness below the moving average
4. Use for trend identification, support/resistance levels, and entry/exit timing
Best Practices
• Combine with other technical analysis tools for confirmation
• Use the color changes as alerts for potential trend shifts
• Consider the 200 EMA as a major support/resistance level
• Works well for swing trading and position sizing decisions
Settings
• Length: Default 200 periods (customizable)
• Source: Default closing price (customizable)
Perfect for traders who want to keep the important 4H 200 EMA visible across all timeframes with instant visual trend feedback.
Open-source script
In true TradingView spirit, the creator of this script has made it open-source, so that traders can review and verify its functionality. Kudos to the author! While you can use it for free, remember that republishing the code is subject to our House Rules.
Disclaimer
The information and publications are not meant to be, and do not constitute, financial, investment, trading, or other types of advice or recommendations supplied or endorsed by TradingView. Read more in the Terms of Use.